Trading Platforms
![]()
MultiCharts is a complete trading software platform for professionals. It offers considerable benefits to traders and provides significant advantages over competing platforms. Whether you need day trading software or you invest for longer periods, MultiCharts has features that may help achieve your trading goals. High-definition charting, built-in indicators and strategies, one-click trading from chart and DOM, high-precision backtesting, brute-force and genetic optimization, automated execution and support for EasyLanguage scripts are all essential tools at your disposal.
Sweet Futures would like you to take advantage of a Free Online Trading Demo. MultiCharts has received many positive reviews and awards over the years, praising its flexibility, powerful features, and great support. So don’t wait, Take a Test Drive Today!
It is critical to have the right trading platform to trade on the stock, futures, Forex, and other financial markets. The right trading software can give you an edge in today’s competitive markets. Watch a short intro video to get a quick overview of the new features in MultiCharts. Remember, you can choose between 32 and 64-bit versions for the one that suits your needs best.
Trading platform that is right for you
MultiCharts’ advantage is based on building robust trading strategies, accurate market data with minimal delivery time, order execution within milliseconds, and lower-than-average transaction fees. With tools such as high-definition charting, technical indicators, backtesting, and strategy execution, everything you need is at your fingertips.
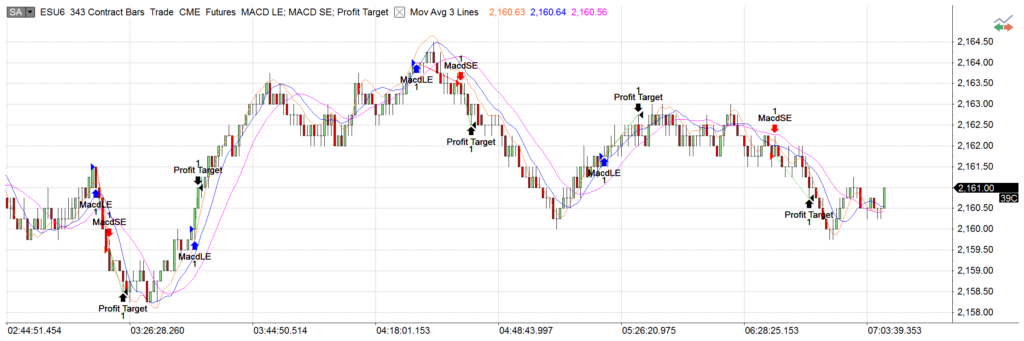
Quick and easy strategy backtesting
You can easily and quickly develop and backtest a strategy before you invest real money. You can test it on historical data as if you were doing market replay. You can make sure that your strategy is not a result of optimized curve fitting —your strategy actually provides a fundamental advantage. Here is extra information on strategy backtesting.
Precision and speed with automated trading
Even with a winning strategy, just a short delay in order execution can make all the difference. After developing a strategy, the next step is to actually send the orders. The key advantage of automated trading is that it can send orders a lot faster than a human being, and this can give you an advantage over the competition.
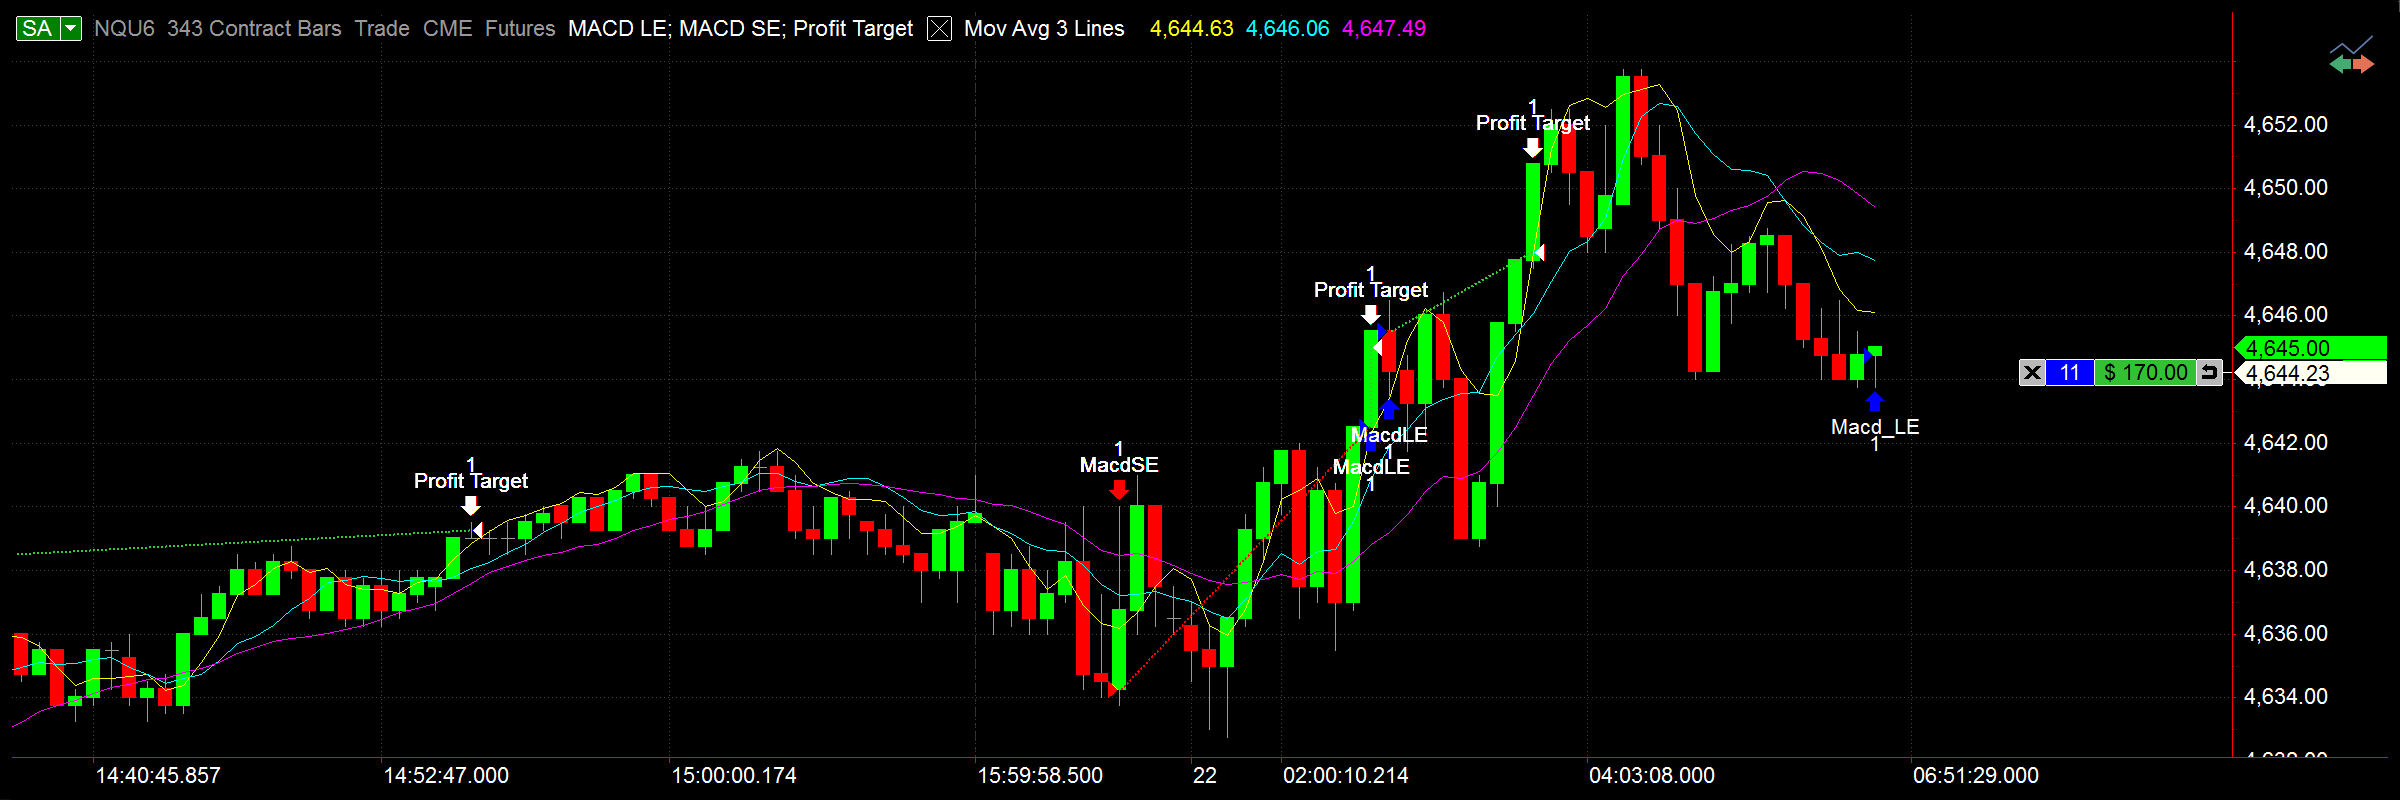
Chart analysis
Charting is one of the most important aspects of trading software. You need to see precise price movements to determine your next move. Charting software needs to be flexible, so that you can adjust any part of it to your particular needs. Charts also need to be reliable, so that you don’t experience any hold-ups or crashes while analyzing important information. We have thought about all of this while building MultiCharts.
Data feeds for anyone’s needs
You can choose the quickest or most economical data feed depending on what you are trying to achieve. Professionals have the option to use Bloomberg as the data feed of choice, while beginner traders can choose Barchart as an economical data feed with good quality data. Traders who do high-frequency trading can access CQG, which provides some of the fastest, real-time quotes. Click on the link to see all of the supported data feeds.
Brokers for your trading style
A choice of trading gateways gives the option to choose from brokers with a high speed of order filling, low price, functional advantages, or good customer service. For example, you can fill complex algorithmic orders with Interactive Brokers or enjoy excellent customer service with OANDA. Follow the link to see the entire list of supported brokers.
Why choose our trading platform?
MultiCharts’ strength is in its features, flexibility, and commitment to following industry programming standards. MultiCharts provides all the necessary features you may need in a trading platform. Our features allow you to create sophisticated strategies for your trading. Our flexibility allows you to choose the optimal data vendors and execution gateways. MultiCharts is also compatible with the industry-standard EasyLanguage developed by TradeStation.
Compatible with EasyLanguage studies
MultiCharts provides nearly 100% EasyLanguage compatibility. This means that thousands of existing studies in this language will work without any changes — the same way they work in TradeStation. You can make full use of the 20+ years of trading experience shared in the EasyLanguage community.
Since TradeStation was a pioneer in the world of strategy trading, it would be unwise to ignore thousands of existing technical analysis studies already written.
Don’t reinvent the wheel
With MultiCharts you do not need to reinvent the wheel or learn a whole new language — you can simply find most information on the Internet. For example, let’s say you want to pass information from MultiCharts to Excel and from Excel to MultiCharts. The answer is — it’s already been done for you. To sum it up, with MultiCharts you automatically get access to a wealth of resources, and you can focus on creating something new — as opposed to spending time on translation into yet another language.
One-click trading from chart and DOM
Take control of your trading and act quickly when you see an opportunity — place orders in seconds through our new Chart trading and DOM. It’s simple and intuitive, you can click or drag-and-drop orders onto your chart.
MultiCharts features many tools to help you achieve your goals — Chart Trading, Trade Bar, Order and Position Tracker, Depth of Market, Forex Board, Automation of Entries and Exits and Symbol Mapping.
Chart trading
No need to worry about typing in the exact price — you can simply drop an order on the chart and you can always adjust it if you need to. You can move your orders around to match other price levels on your chart, such as breakout or support levels, or drag more orders. You can also drag-and-drop automation strategies to further enhance your trading comfort and speed.
Trade bar
It’s simple and precise — you can type in the exact price, choose the order and buy or sell. This toolbar also has tabs, one for each broker profile you create. You can easily switch between different accounts, or even brokers, and trade what you need.
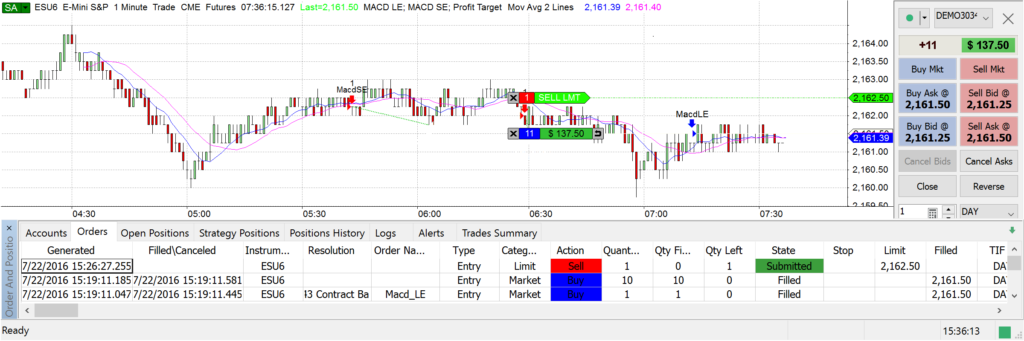
Order and position tracker
You see a detailed summary of your orders, positions and accounts across all brokers that you are trading. You can cancel or modify pending orders, or even flatten entire positions directly from this window. All information is in one convenient place, and you can sort and filter to zoom in on the pieces that you need. You can also export the reports into Excel for further analysis.
Symbol mapping
MultiCharts allows you to trade through any broker from any chart, but sometimes brokers and data feeds give different names to the same symbol. Symbol mapping lets you translate between the chart and the broker by filling out necessary details, and making the symbol understandable to the broker.
Depth of Market (DOM)
The DOM is an industry-standard tool that lets you see market depth and trade with one click. In MultiCharts you can see ten price levels each way, and apply entry and exit automation directly in the DOM window.
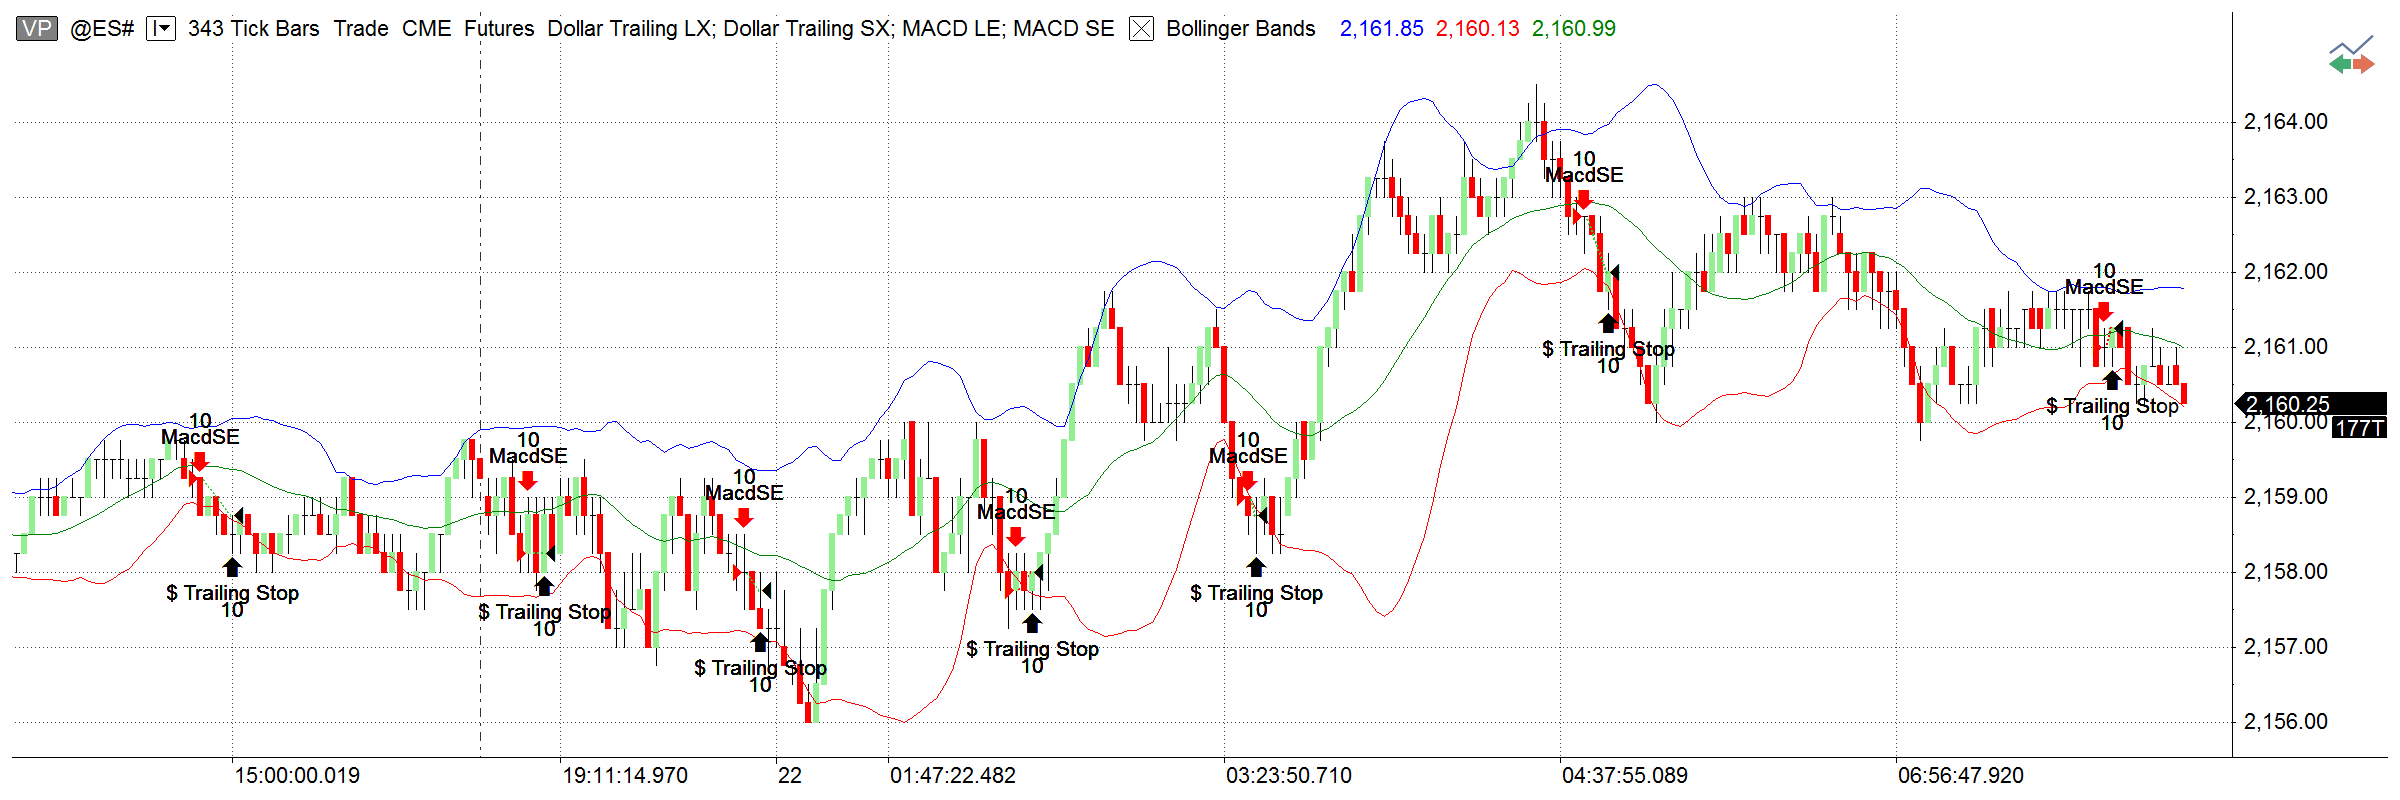
Entry and exit strategies
Sometimes there is no time to place entry or exit OCO orders by hand, so we built some automation strategies that you can simply drag-and-drop onto your chart. You can drop them onto any point on the chart, or attach them to a particular order or position.
Charting is one of the most important aspects of trading software. You need to see precise price movements to determine your next move. Charting software needs to be flexible, so that you can adjust any part of it to your particular needs. 64-bit version of MultiCharts lets you easily view charts of any length, limited only by the amount of memory in your computer.
For technical information on this feature look at the related Wiki page.
Complete and informative charting
To make the right choice it is equally important to see the small details and the big picture. In MultiCharts, you can easily perform multi time frame analysis without cumbersome extras, such as custom DLLs and global variables.
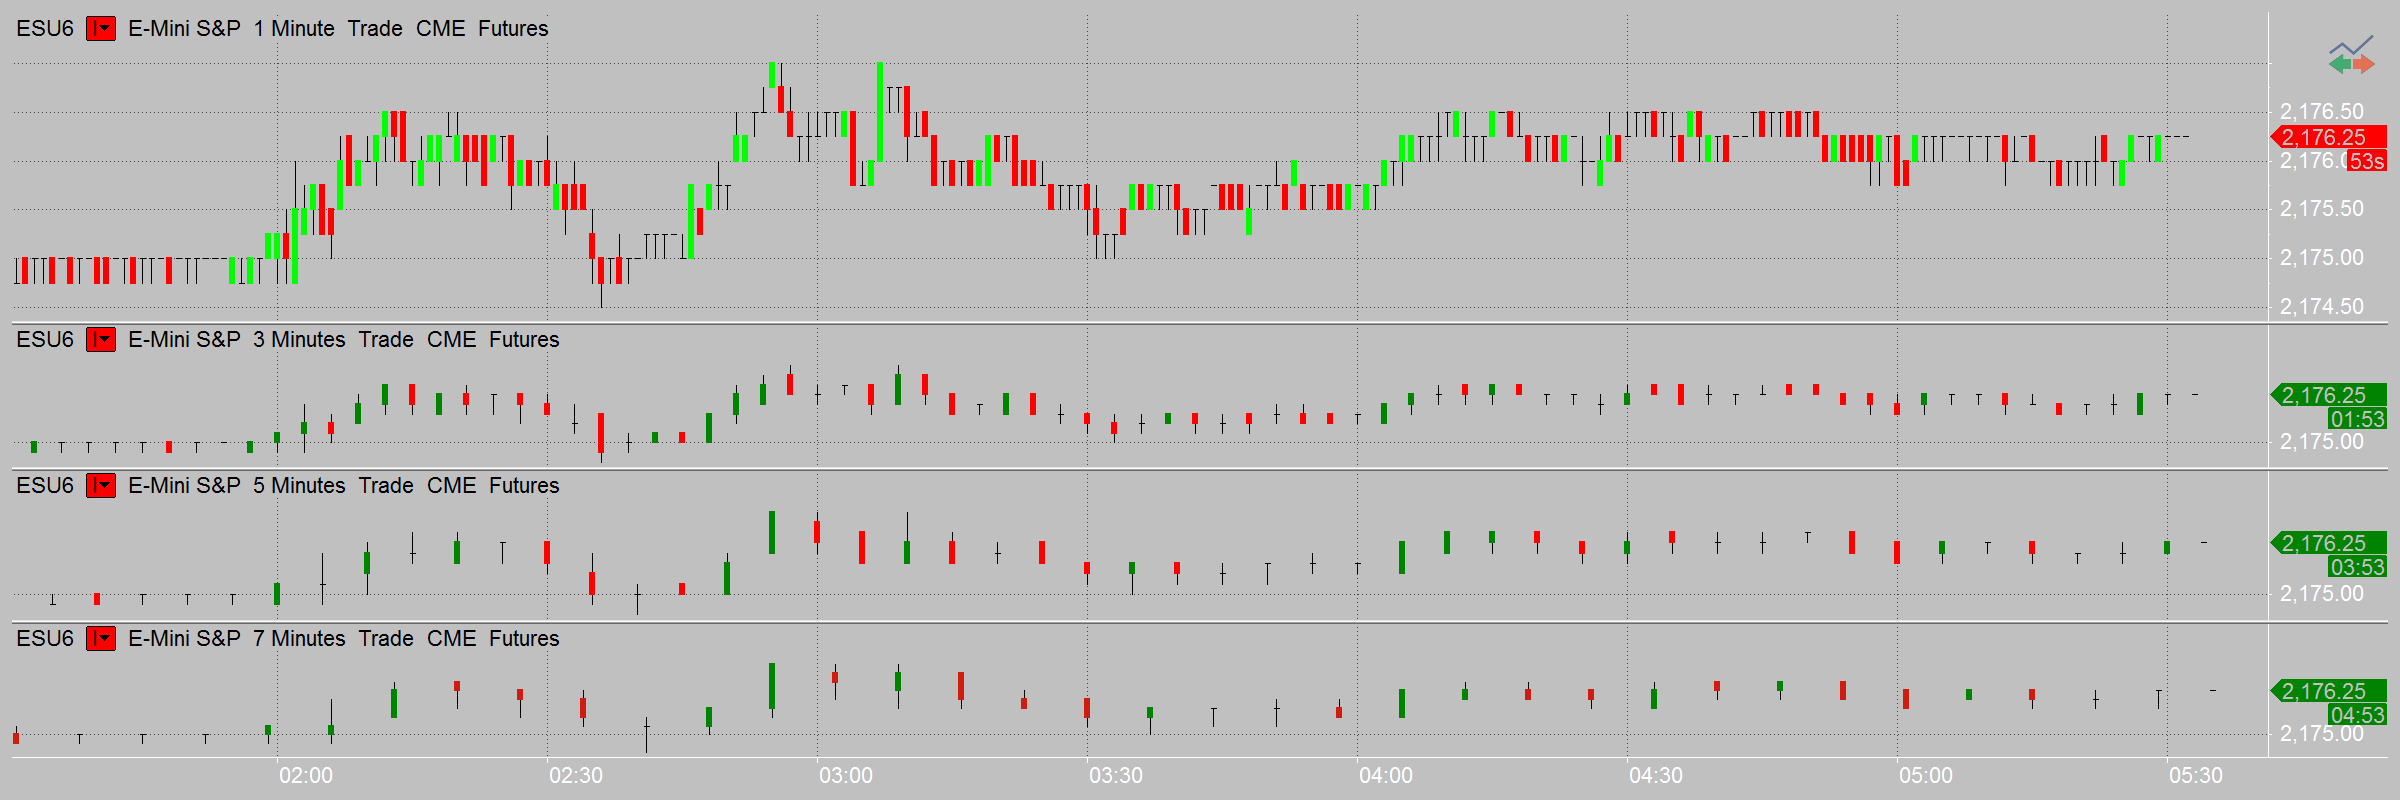
Several data series in different resolutions
Working with several data series is one of the main features in MultiCharts. There is no need for cumbersome workarounds—you can simply add several price series into one chart window. The trading platform allows you to mix any resolutions, and it automatically aligns them on the time scale. For example, you can view hourly resolutions with daily resolutions, one-second symbols with 10-tick symbols, or range bars with volume bars.
Behind-the-scenes calculations for multiple data series
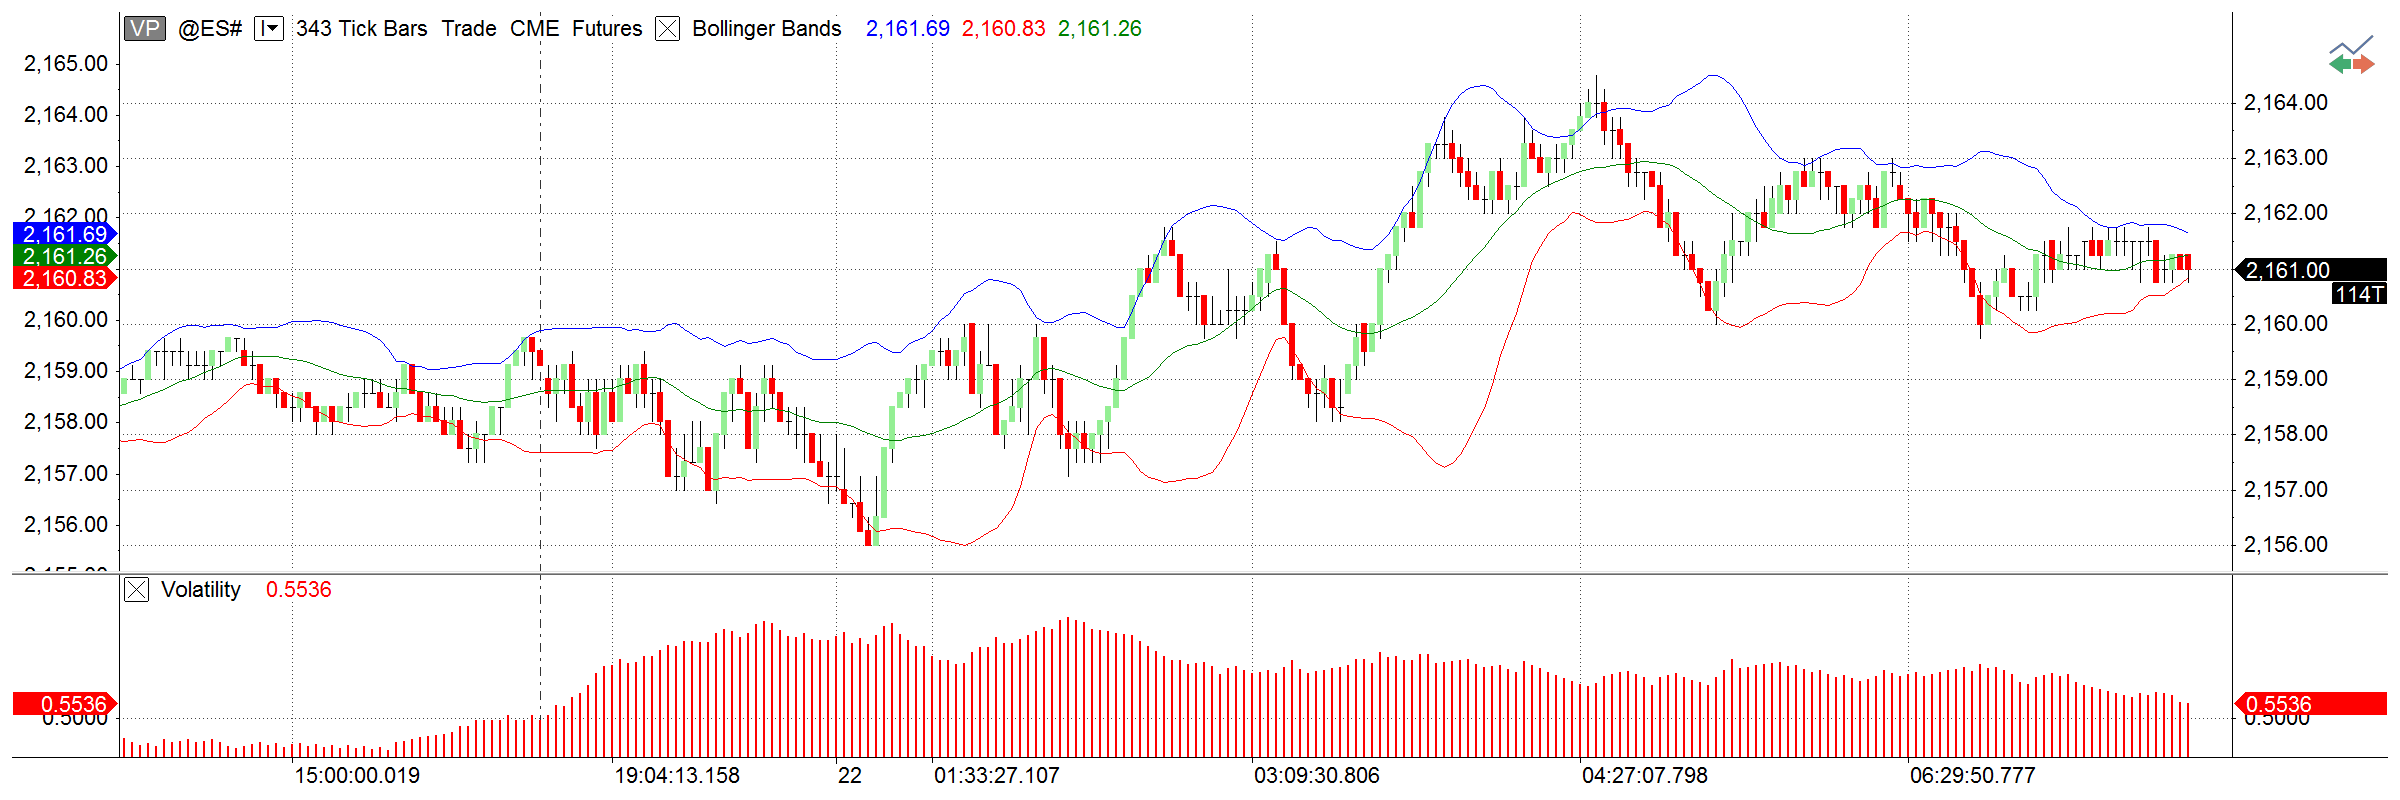
This feature allows you to create indicators or strategies that use several data series for its calculations. For example, you could use Bollinger Bands on a one-minute chart, but it will be calculated based on daily data. You only need a few clicks to accomplish this. The program does all of the calculations behind the scenes. It even chooses the correct visualization, such as overlaying data series.
Combine historical and real-time data from different feeds
On top of that, you can combine historical data from one provider and use real-time data from another, in one or more subcharts. This provides the flexibility and choices necessary to meet the needs of your individual trading style. For example, imagine that your datafeed does not provide ask and bid history, but does provide quality minute data. In this case, you can combine minute data from your datafeed with data from other vendors to get the complete picture.
Use up to 20 subcharts per chart
You can create up to 20 subcharts per chart, which allows for complete analysis of the big picture. In addition, you can use bid, ask, and trade data, and you can receive data from different providers all in the same chart.
Add dynamic comments to charts
Expert Commentary lets you add bar-specific dynamic comments to indicators, which then appear when a user clicks on a certain bar. The indicator performs some calculation behind the scenes, and displays text that you define, for example: “Trend is bearish on this bar”, or “Breakout up possible”.
Interactivity with everything you see
Innovative object-oriented user interface sets MultiCharts apart from conventional charting software. You get an intuitive, easy-to-use application, which dramatically reduces your learning curve.
Customization and flexibility that meets your needs
You can customize the look of MultiCharts from the overall appearance to the tiny details. You have full control to focus on the important data without overcrowding it with excess information.
Adjustable
The colors can be adjusted to quickly pick out important information. Bar spacing can be adjusted for easier viewing. Change the zoom and the margins for optimal chart setup. Session breaks, empty periods, indicators, price series, title bars, scroll bars, and divider lines are all easily customized to improve the way you view information.
Dynamic
Changing the visual order of data series, colors, spacing, font labels, divider line styles and more is another great way to pinpoint important information. Chart compression locates the needed data—even among millions of bars. Various dynamic grid styles are supported for added flexibility: point, solid, horizontal, dotted, or detailed dotted grids.
More resolutions mean more possibilities
Standard chart resolutions include both time-based and count-based options. Time-based choices include anything from seconds to years. Count-based resolutions are presented by ticks, number of trades, number of contracts traded, price range, and number of changes options.
Millions of bars on one chart
In addition, the 32-bit trading platform can easily display 7.5 million bars on one chart for visual analysis and backtesting, which is usually available only in high-end, institutional products. The 64-bit version takes it even further and can display any number of bars, limited only by the amount of memory on your computer.
No volume loss
Volume bars in MultiCharts are calculated based on the capped principle. This means that the remainder of the volume is transferred to the next bar. For example, if a tick arrives with the volume of 100 and your chart resolution has a volume bar of 75, then 25 will be transferred to the next bar. With this method, no volume is lost.
Hourly bars vs. 60-minute bars
Hourly bars are different from 60-minute bars. Hourly bars use an astronomical clock, but 60-minute bars are bundled together. With the one-hour resolution, the hourly bar would be from 8:30 to 9:00—not from 8:30 to 9:30, as it would look on a 60-minute bar.
Resolutions as you like
Custom resolutions, such as 90 ticks, six seconds, seven minutes, five hours, two days, or six weeks can be easily set for any symbol, or a group of symbols. There is also a Change resolution, which constructs a bar based on the number of changes.
Volume bars by tick or actual trade volume
Volume for bars can be calculated based on the number of ticks or the actual trade volume that occurred.
Price scales and axes made for precision
Our trading platform allows you to set the price scales to match the type of analysis. You may choose between linear or semi-log axes for drastic price movements; two separate vertical scales, one for indicators and one for price movements; or even no vertical axes at all.
Different views, different angles
Each scale can display the data from various angles. For example, a scale can show minimum to maximum values for the entire data range or only for a certain part of the series. Other useful touches include the ability to center the graph on the middle of the scale, set number of digits after decimals, and define the amount of labels present.
Overlay several price series
An important feature of trading software is the ability to overlay several price series with independent price scales. For example, it is possible to chart a financial instrument that costs several hundred dollars over another instrument that trades under a dollar. Then you can visualize the dynamics of price movement.
Precision where it counts
For added convenience, the Precise Price marker shows the exact last price and the Countdown feature shows how much time is left until bar close.
Details where you need them: Cursors, Data Window, and Hint Window
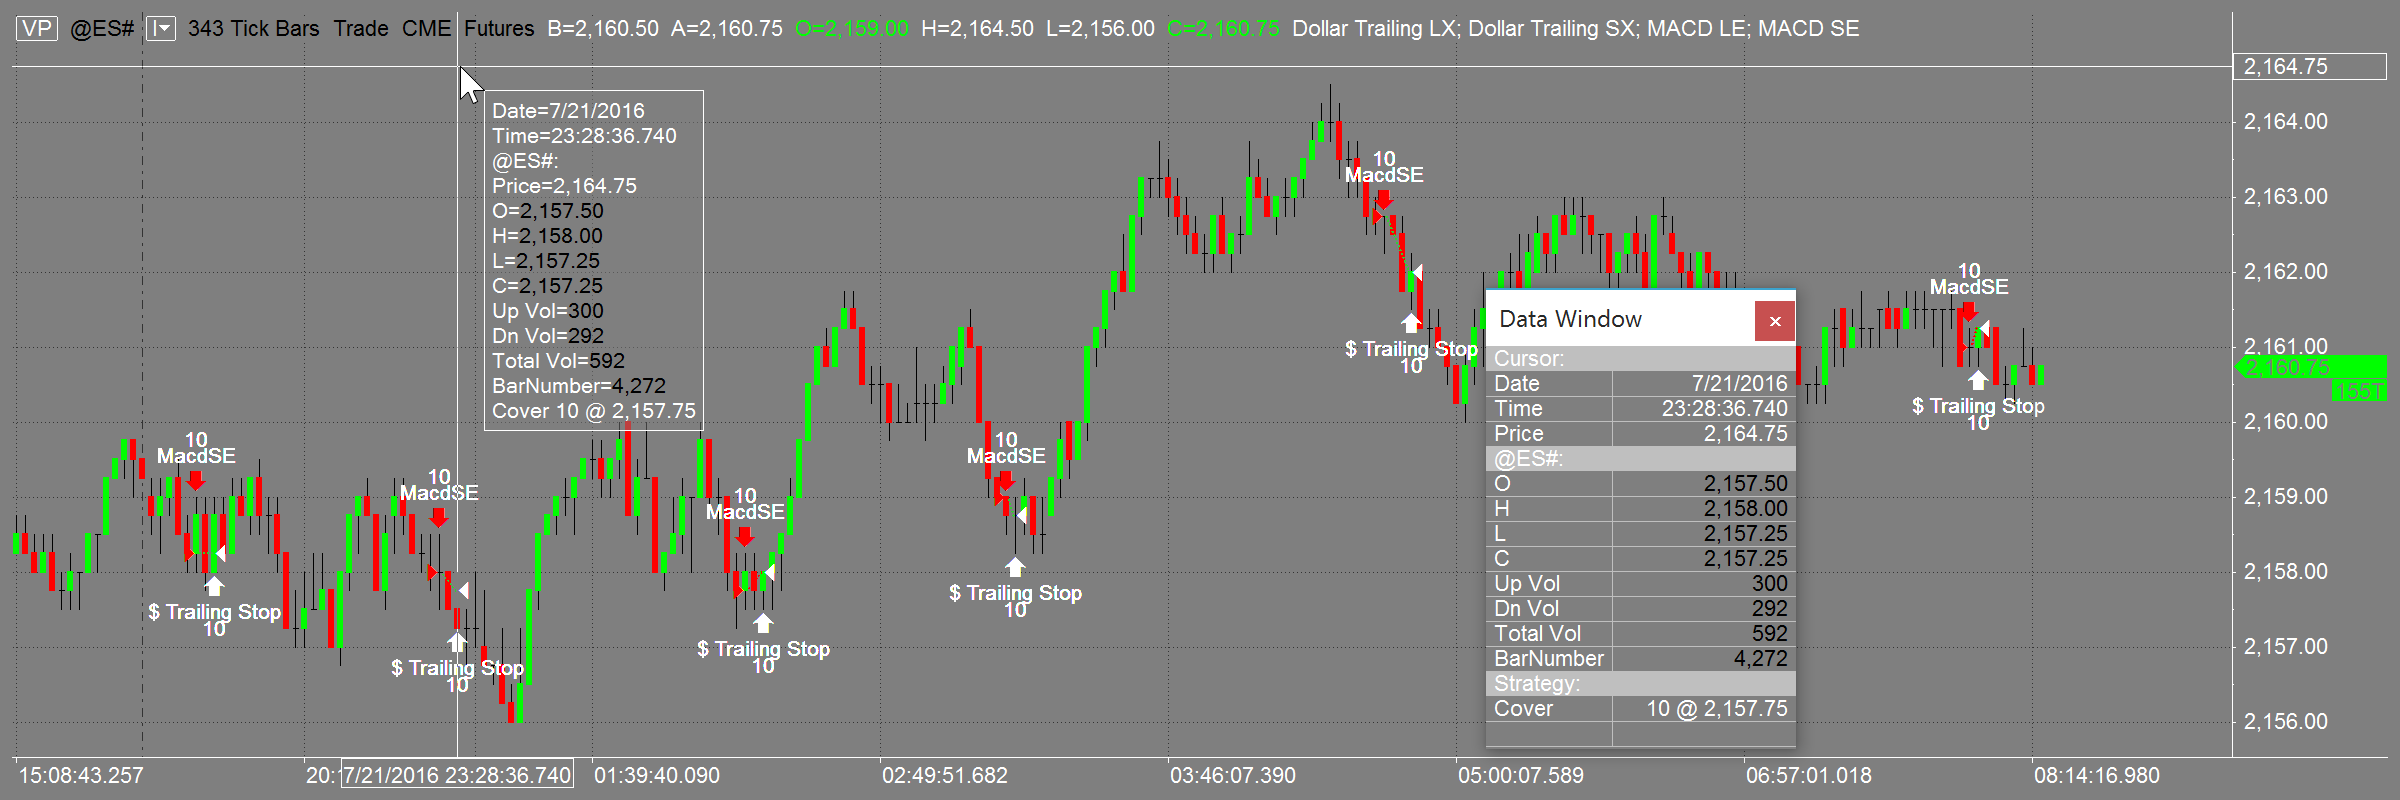
When working with charts, the ability to quickly pinpoint the exact price is critical. The Data Window remains on the side of the screen, showing you the current market situation. However, if you need to study a particular area on a chart, the Hint Window conveniently appears at the tip of your cursor.
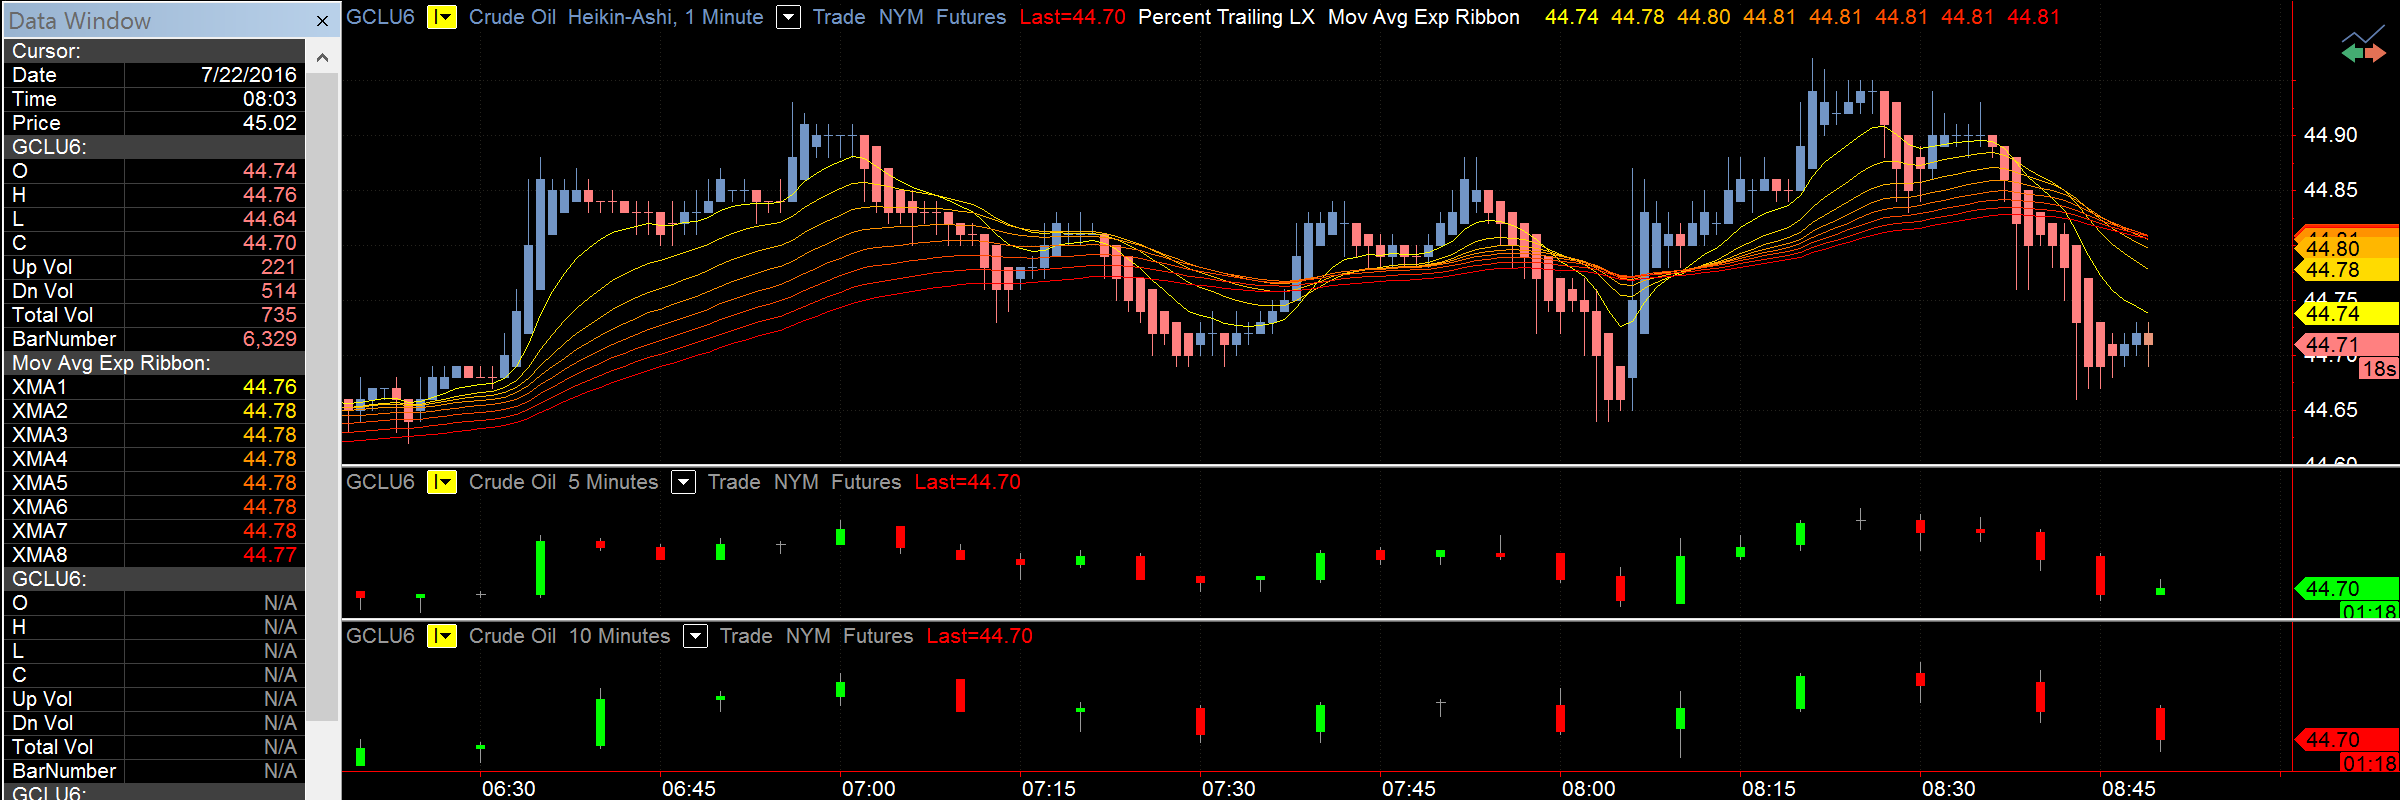
Your data window
Knowing the exact price at any given point in time is key to trading the markets. The Data Window conveniently stays put on the left side of the screen with all relevant information laid out in an easy-to-read format. It is attached to the main platform window for easy viewing, but it can also be detached and floated like any other chart.
The hint window
If you are analyzing an area on the chart and don’t want to keep looking over at the Data Window, simply click on the chart and the Hint Window appears. It shows you price values, indicator values, and strategy-generated orders for the bar that you’re viewing. Also, the Hint Window can always follow your mouse, or you can make it only appear on demand.
A choice of cursor styles
From various cursor styles (including hand, cross, price tracking mode, and a global cursor that synchronizes many charts) to the floating Hint Window and the stationary Data Window, MultiCharts features a complete package that accurately and quickly tracks price changes and indicator values.
Background dragging
Many traders prefer to ‘grab’ the chart with the mouse cursor and move it around to look for opportunities. The background dragging button on the toolbar turns this mode on and off.
Choice of timestamps and trading sessions for wherever you are
You can display data series using either local or exchange timestamps. Also, in addition to hundreds of existing trading sessions, you can create custom ones to suit trading any instrument and in any time zone.
View charts any way you like
Several custom trading session templates can be used at the same time for any one symbol, which means that you can get a different angle on your trading. For example, one chart can show pre-trading and regular hours, while another can show you just the regular hours. This can be useful for practicing and learning whether your predictions are correct. The sessions can be changed easily using the Format Instrument dialog window.
Timestamps for synchronizing
The choice of different timestamps can be very useful for trading financial instruments worldwide or synchronizing multiple charts to avoid confusion.
Create your own templates
If you want to trade only certain hours of the day or your exotic exchange is not supported by default, you can easily create your own templates. This means you can use MultiCharts in any part of the world, and you can trade any instrument on the worldwide electronic markets.
The importance of volume analysis cannot be underestimated. Paying attention to volume can make the crucial difference in understanding how the market will move. The following tools were designed to help you understand not only how much was bought but at which prices activity was the highest, and whether there are more buyers than sellers. For technical information on this feature look at the related Wiki page.
Volume Profile
Volume Profile is a vital tool that shows the most traded prices for a particular time period. It plots volume as a histogram on the price bar, so you can see the levels where you need them.
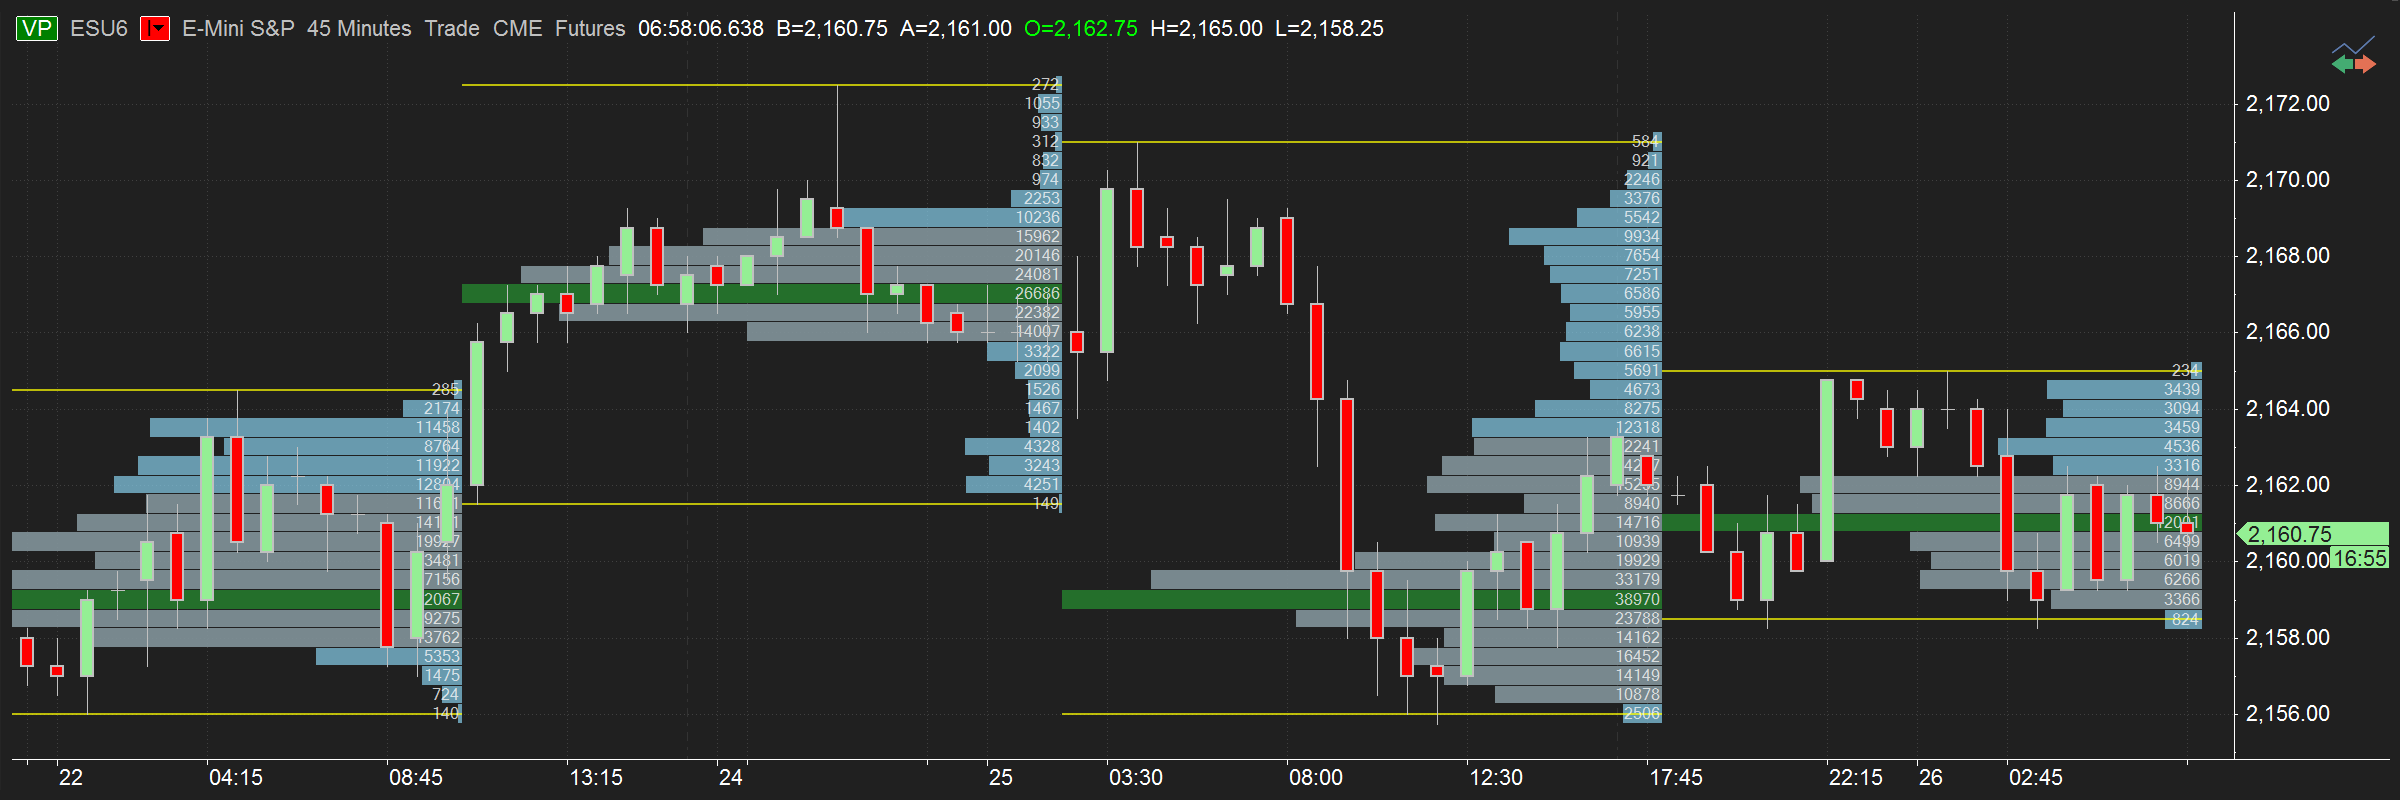
Various combinations of volume and tick data
Display option determines the way you arrange the volume data or a group of ticks. There are several ways to show Volume Profile data in MultiCharts: Tick Count, Total Volume, Sell x Buy Volume, Delta option, Buy vs Sell Volume. For example, Total Volume displays ask + bid volume provided by a data source for every tick. If Buy vs Sell option is selected, it displays total volume value in each line and the line is colored in green/red (by default) depending on whether the ask volume is greater or smaller than bid volume. More info on how to set up Volume Profile Display is here.
Two ways to set up Volume Breakdown
There are two methods available in MultiCharts that specify how to differentiate Buy and Sell volume. You can choose either Ask Traded vs Bid Traded or Up Ticks vs Down Ticks option. Ask Traded vs Bid Traded method compares the current tick price with the current Ask or Bid tick price. Up and Down Ticks breakdown uses the comparison of the current and the previous tick price. Learn more details of this option on our Wiki page.
Tick-based bid and ask volume
MultiCharts downloads historical trade, ask and bid ticks and locally transforms them into an accurate volume representation. Trade prices are compared to asks and bids to determine at which price the trade happened. IQFeed data feed, for example, sends accurate historical ask and bid information which ensures that Volume Profile is precise.
Choose the needed resolution
You can display a volume profile on a per-bar basis, for the session, or for the entire week – all depending on what you are trying to see. Note: when your chart is set to “1 week” or higher resolution, you can only use per-bar setting.
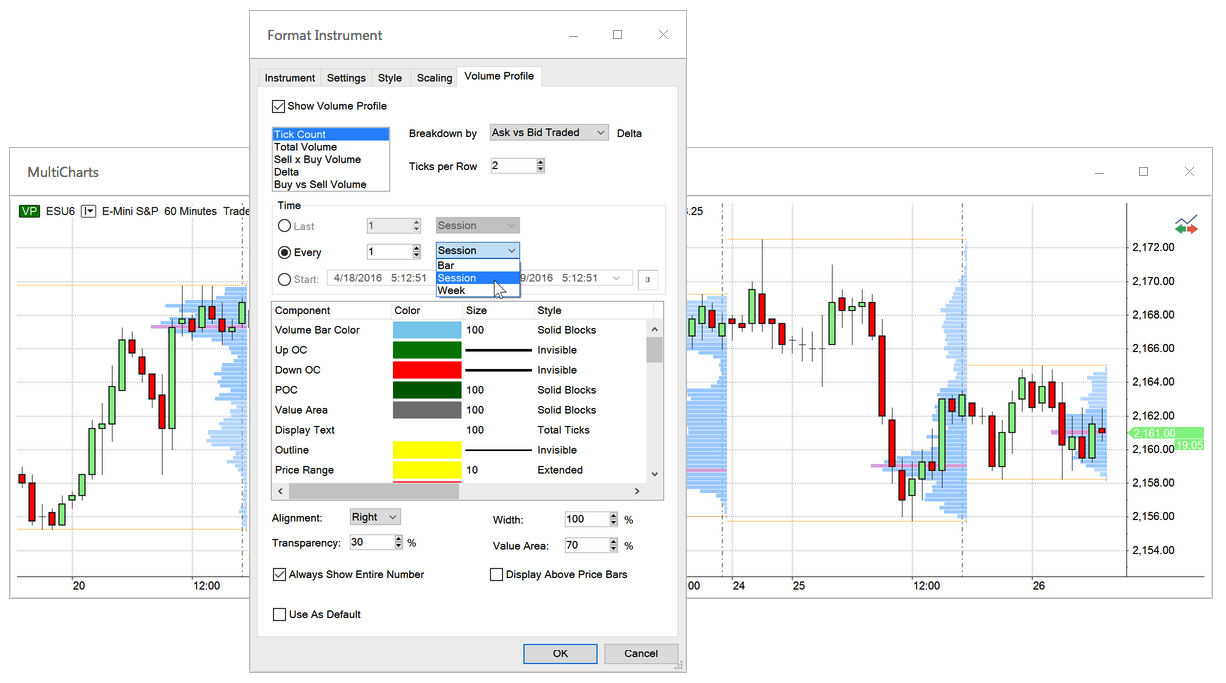
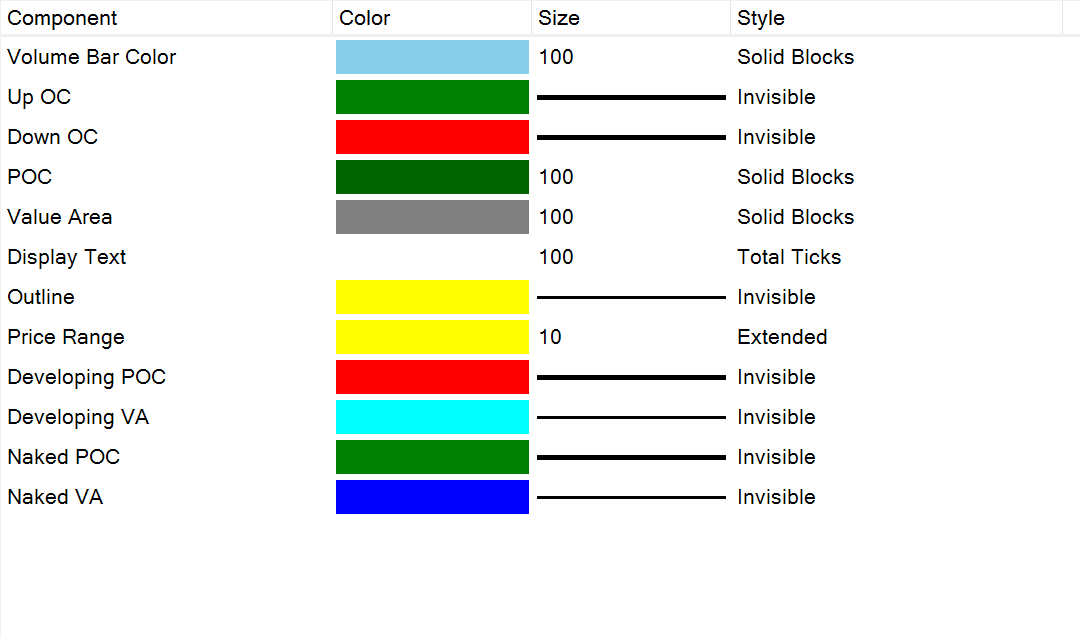
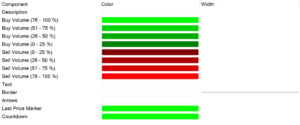
Customize Volume Profile components
You can change to your liking the color, size and style of any component. For complete information about our Volume Profile, visit our online Wiki Volume Profile page.
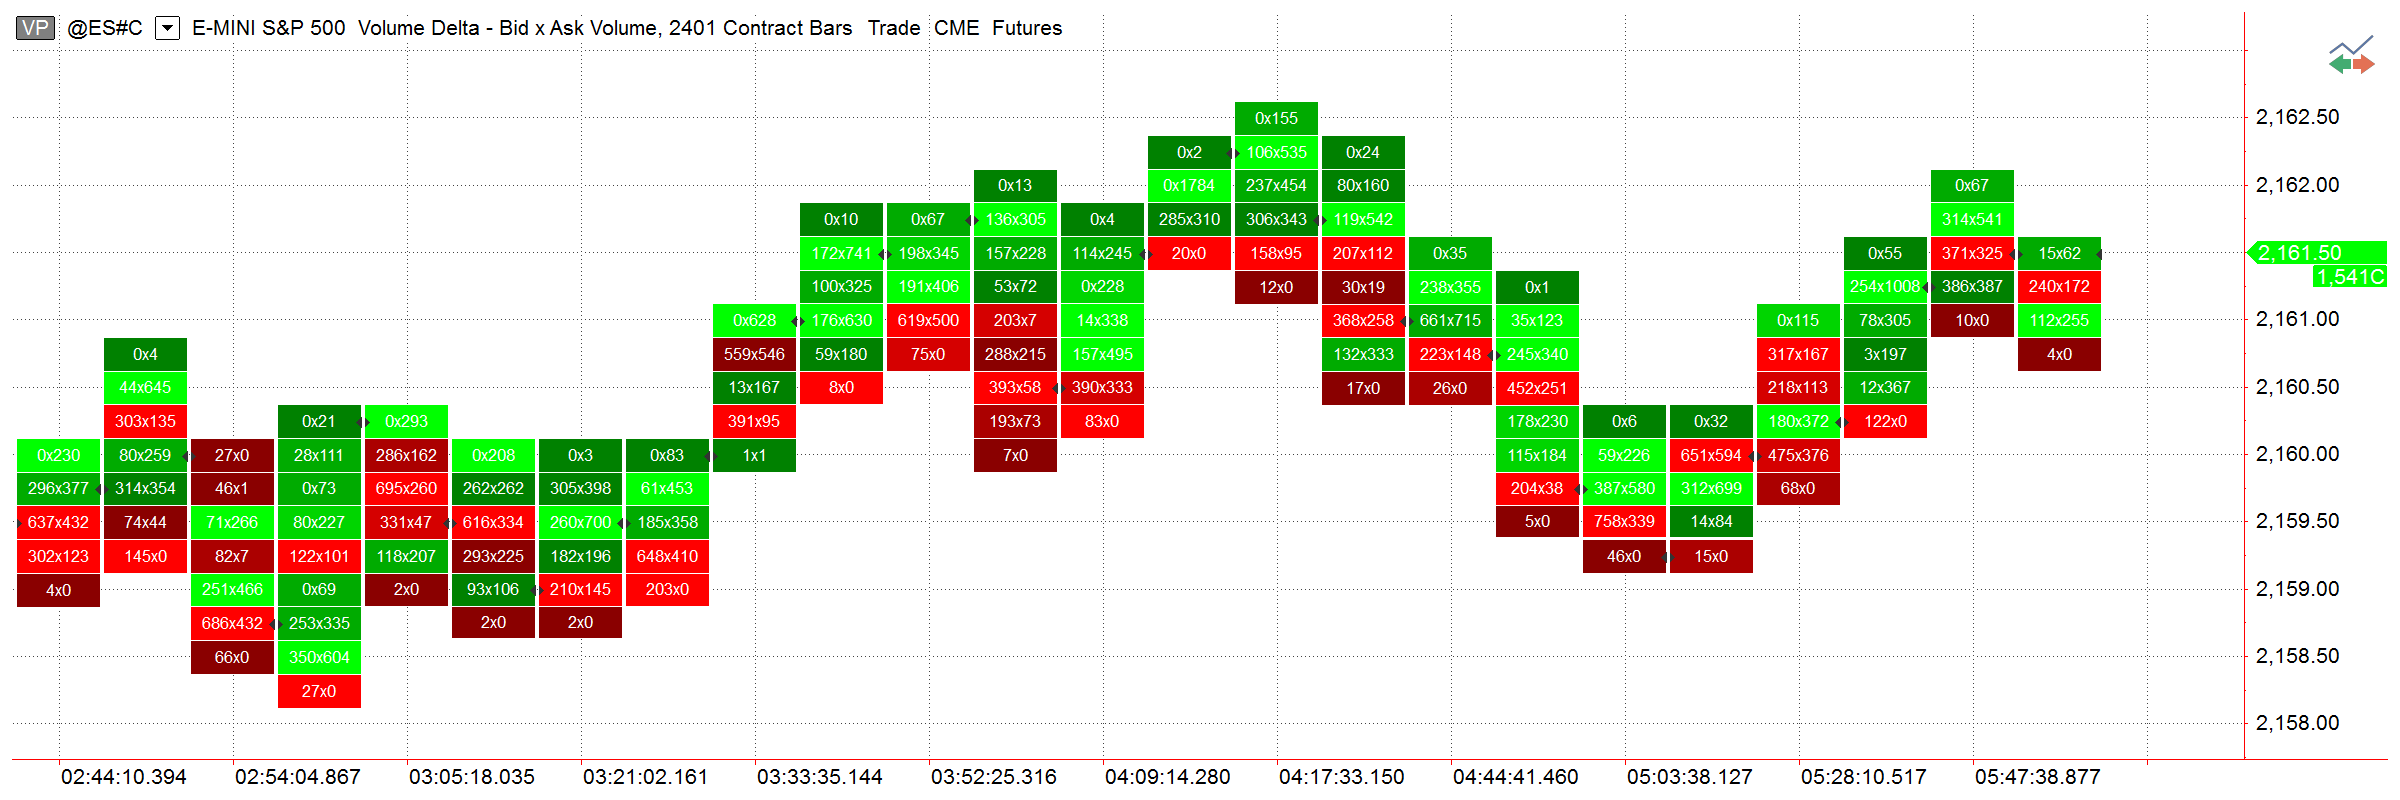
Volume Delta
Volume Delta helps you keep track of trades that were completed on ask or bid prices in real-time. It plots a series of boxes with volume displayed inside them.
Setting up Volume Breakdown
There are two methods available in MultiCharts that specify how to differentiate Buy and Sell volume on Volume Delta charts. You can choose either Ask Traded vs Bid Traded or Up Ticks vs Down Ticks option. Ask Traded vs Bid Traded method compares the current tick price with the current Ask or Bid tick price. Up and Down Ticks breakdown uses the comparison of the current and the previous tick price. Learn more details of this option on our Wiki page.
Arrange the volume data the way you want
Display option configures how volume is shown inside the box. One can set it up according to his or her requirements. There are three methods available for MultiCharts users: Bid x Ask Volume, Total Volume or Delta (Ask – Bid Volume).
Volume Delta and Profile histogram styles
Volume Delta is traditionally shown in rectangular boxes with the color fill gradient ranging between red and green, depending on the volume values. Profile style (available when volume is shown as Delta) transforms the boxes into a histogram for easier perception of most active price levels.
Customize Colors, Sizes and Styles of the components
 You can display a volume profile on a per-bar basis, for the session, or for the entire week – all depending on what you are trying to see. Note: when your chart is set to “1 week” or higher resolution, you can only use per-bar setting.
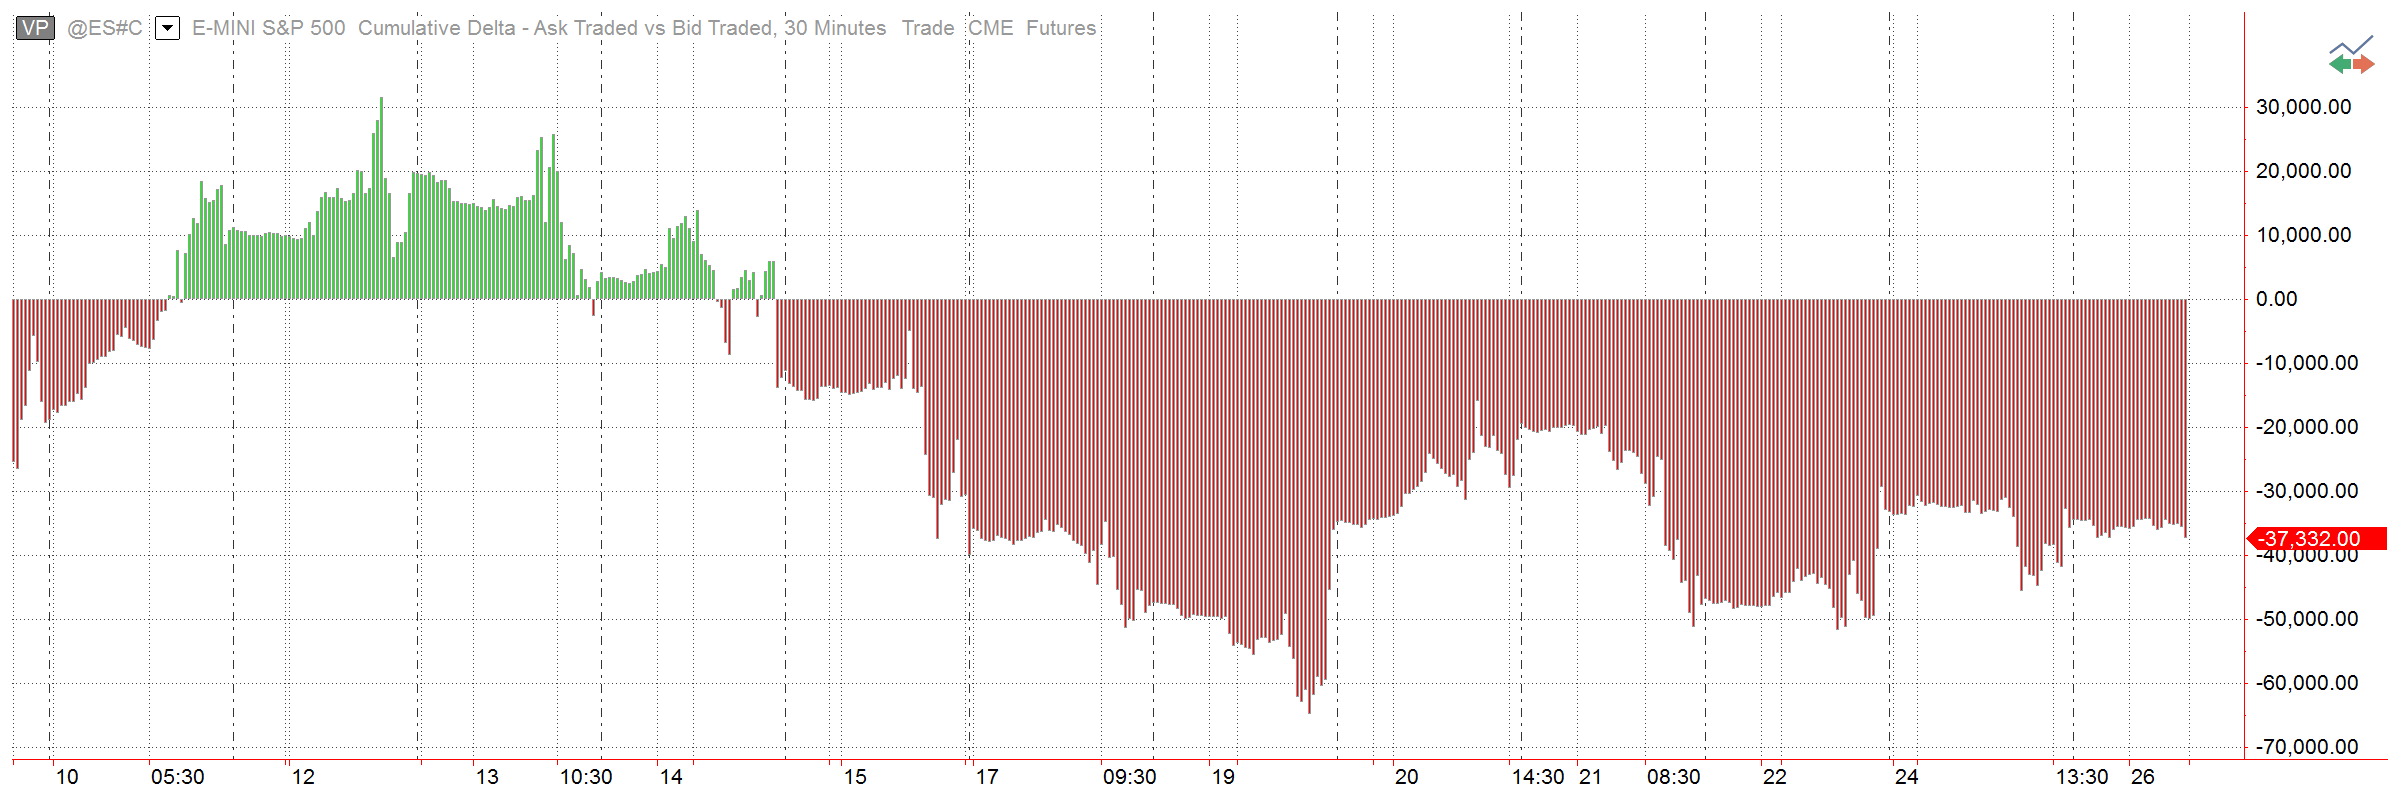
Cumulative Delta
Knowing if there are more buyers or sellers at particular price can be an important indication of where the market is going. Cumulative delta plots the difference between asks and bids to give you that info.
Customize Cumulative Delta charts
You can change to your liking the color, size and style of any component. For complete information about our Cumulative Delta, visit our online Wiki Cumulative Delta page.
Histogram Style
Cumulative Delta charts use time for the X-axis and its own scale for the Y-axis. The histogram is a convenient way of visualizing how far from the central zero line the delta deviated.
Volume Breakdown
There are two methods available in MultiCharts that specify how to differentiate Buy and Sell volume on Cumulative Delta charts. You can choose either Ask Traded vs Bid Traded or Up Ticks vs Down Ticks option. Ask Traded vs Bid Traded method compares the current tick price with the current Ask or Bid tick price. Up and Down Ticks breakdown uses the comparison of the current and the previous tick price. Learn more details of this option on our Wiki page.
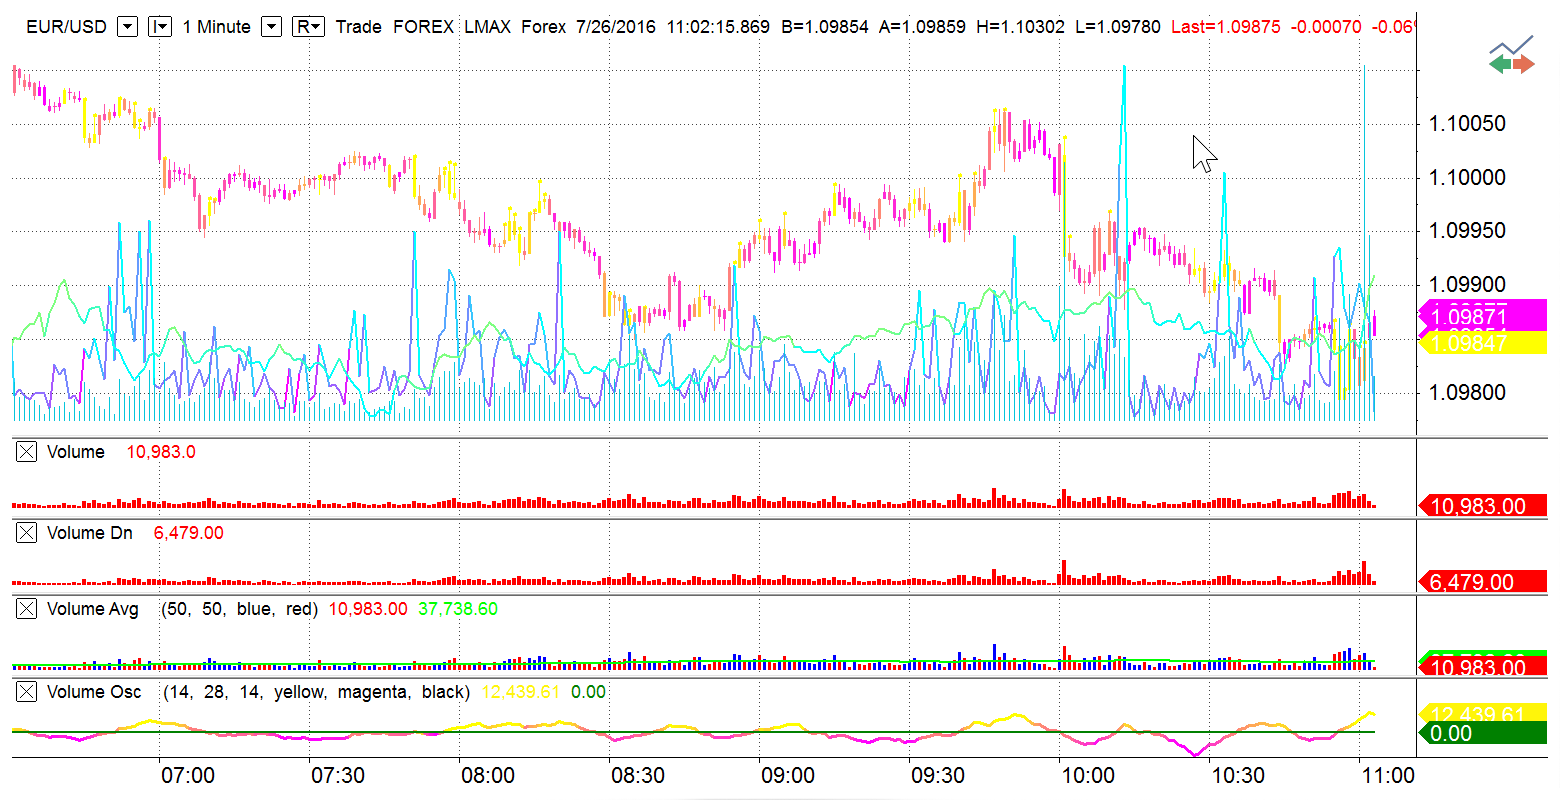
12 Pre-Built Volume Indicators
MultiCharts has 12 indicators included to help visualize volume in different ways. TimePriceOpportunity is of special interest when working with 2 data series.
List of Volume Indicators:
- TimePriceOpportunity (TPO)
- Volume
- Volume Average
- Volume Breakout
- Volume Down
- Volume Gradient
- Volume Oscillator
- Volume Rate of Change
- Volume Ratio
- Volume Today
- Volume Up
- Volume Weighted Average Price