
Trading Platforms
Standard charts show you where the price has been. ATAS reveals the data that moved it there.
It is a high-performance Order Flow & volume analysis platform that decodes raw, tick-by-tick exchange data into clear visual structures. By providing a transparent view of CME, EUREX, and ICE markets, it gives you the tools to evaluate the mechanics behind price action — focusing on real-time supply and demand rather than lagging indicators.
Core Capabilities:
-
Institutional Data Visualization: Transform complex order flow into intuitive Heatmaps and Footprint charts.
-
Multi-Asset Workspace: Seamlessly switch between Futures and Global Crypto markets within a single professional interface.
-
Stability & Support: A time-tested ecosystem for Windows, with supported access for macOS users via Parallels.
ATAS X (Beta) – New-Gen Performance
Experience the evolution of market analysis with ATAS X. Built on an entirely new engine, it is designed for traders who require native hardware integration and zero-latency data processing during high-volatility events.
The X Advantage:
-
Native Cross-Platform Support: Runs natively on both Windows and macOS. No emulators required.
-
Data Throughput Optimization: Specifically engineered to handle massive tick-data flows during market openings and high-impact news events.
-
Modern Analytical Interface: A high-resolution interface focused on workspace efficiency and visual clarity.
Advanced Liquidity & Order Flow Analysis
Analyze the behavior of market participants as it unfolds. ATAS integrates high-frequency data with intuitive visualization, allowing you to track the constant interplay between resting limit orders and aggressive market activity.
High-Fidelity Heatmap (Beta)
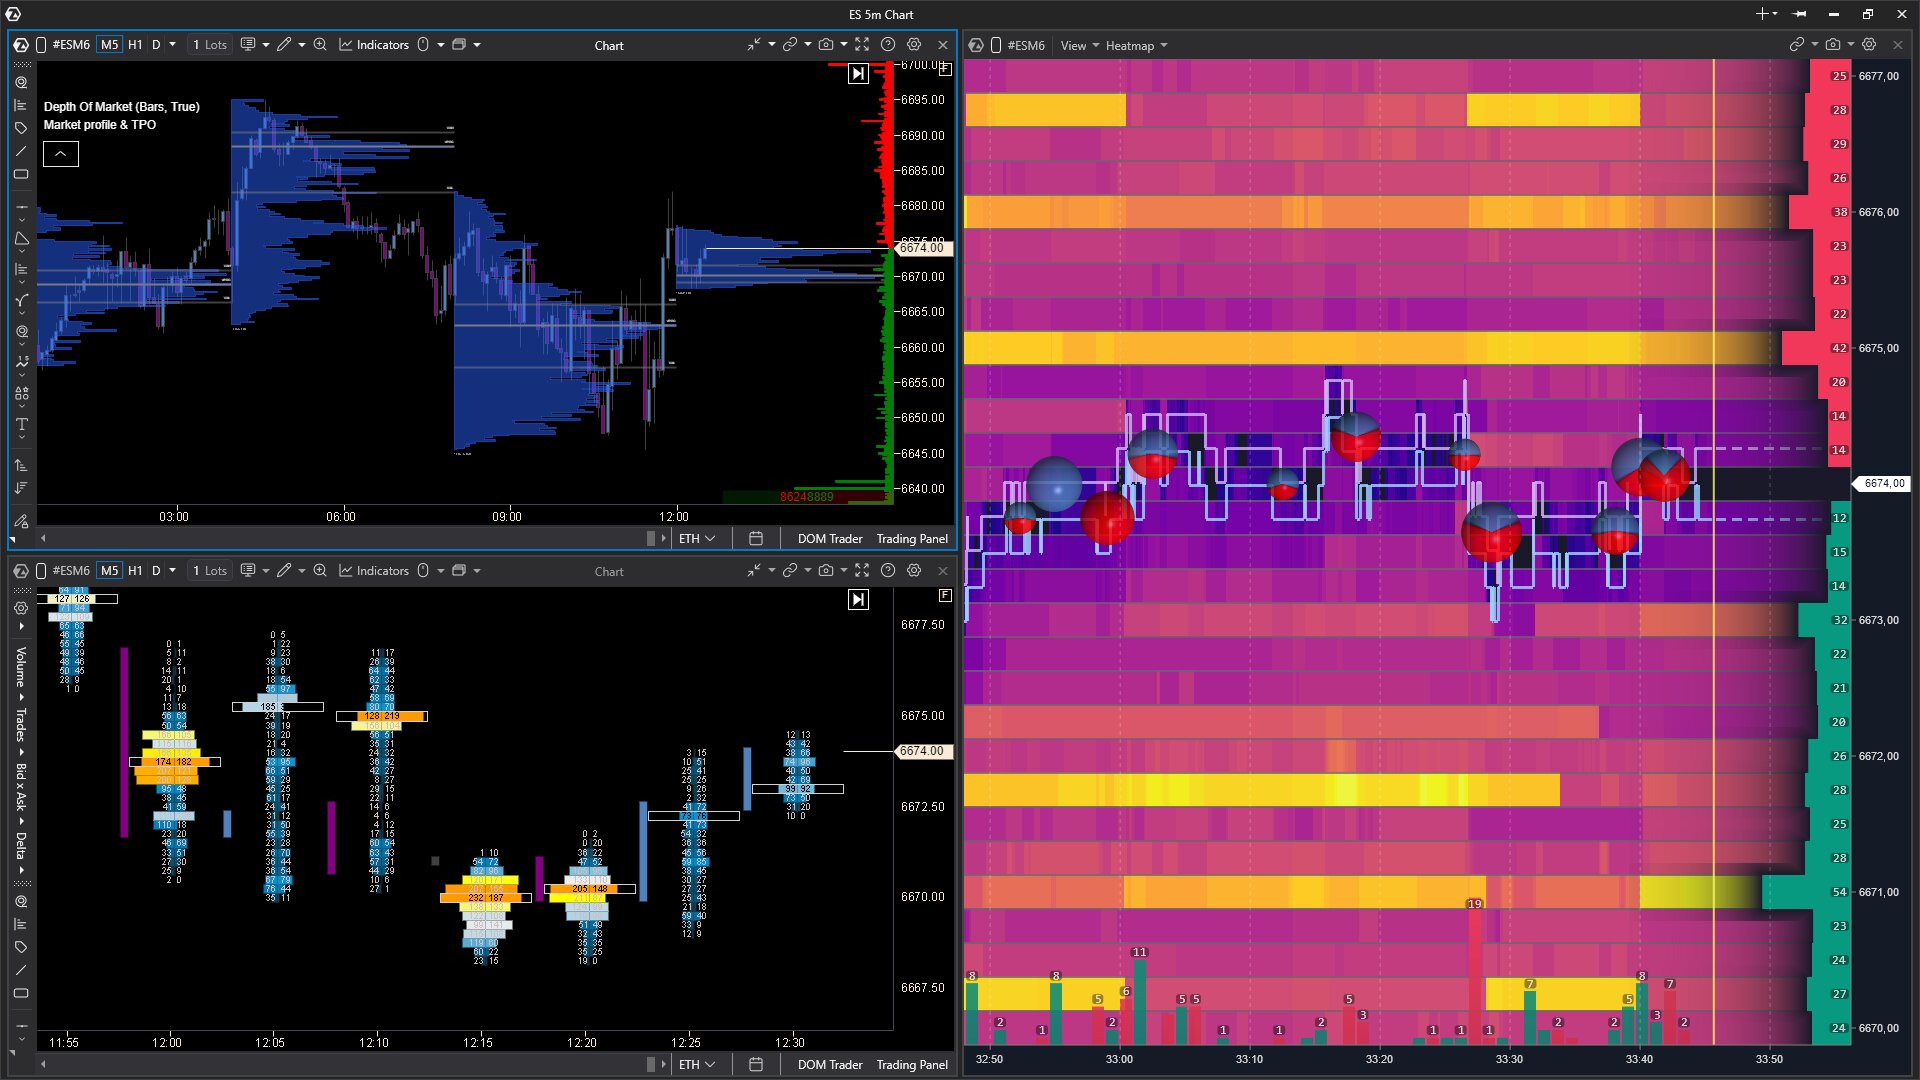
The Heatmap renders the limit order book with precision:
-
High-Speed Fluidity: 600+ FPS ensures you catch rapid order book shifts — including spoofing activity — that standard charts miss.
-
3D Volume Depth: Switch to 3D to see the actual “weight” of liquidity levels, not just colors.
-
Bubbles: Track aggressive market orders as they hit limit orders in real time.
-
Full Sync: Price-axis sync across all charts and the DOM for a unified workspace.
Advanced Order Flow Tools
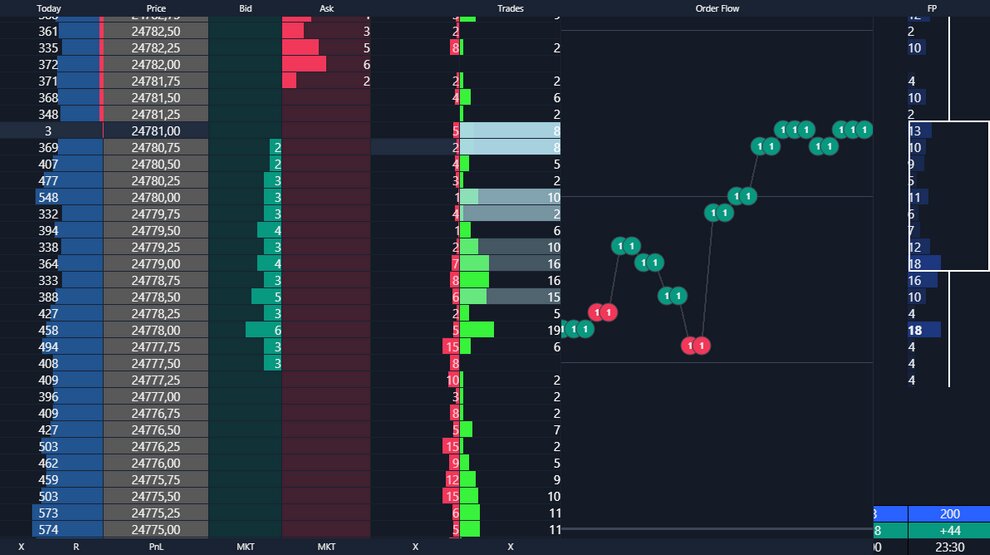
Smart DOM. An all-in-one workspace. It centralizes market data and order management in a single window, revealing the “thickness” of liquidity at every price level. By tracking where limit orders are added or pulled, you can identify hidden support zones and manage your orders with precision — without switching to a separate chart.
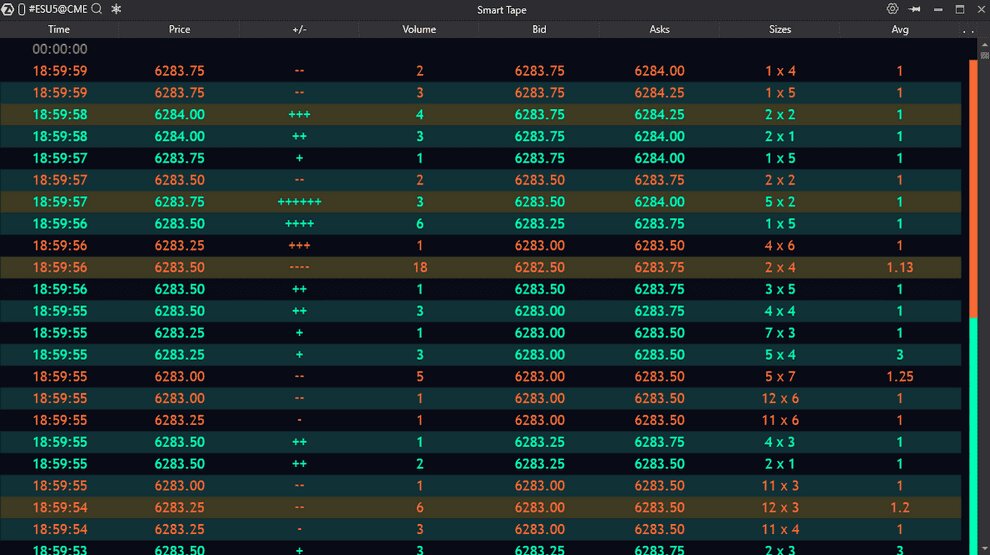
Smart Tape. Converts the chaotic Time & Sales feed into a clean, readable flow. It intelligently groups fragmented prints, letting you spot large-scale activity at a glance without the visual noise.
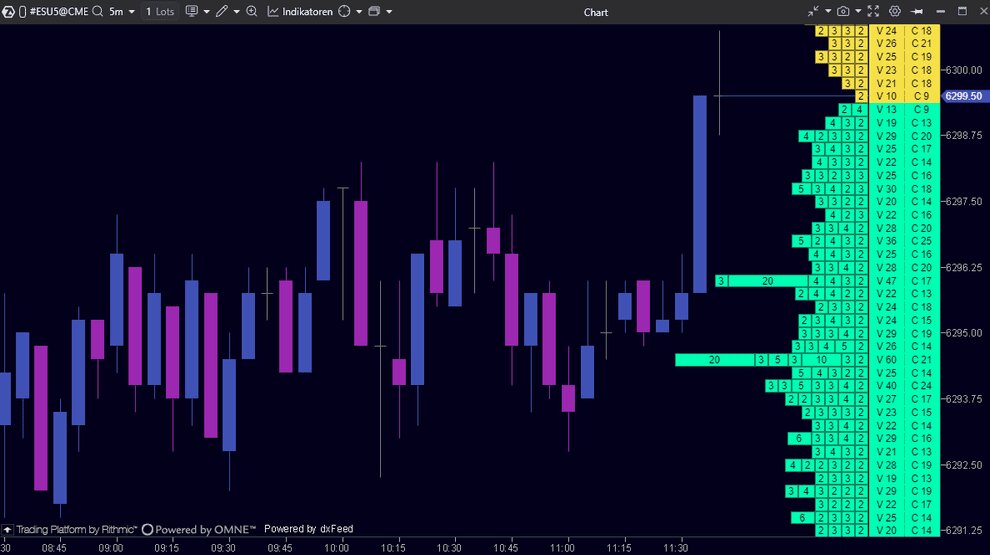
MBO (Market By Order). Track the exact position, time, and priority of every limit order in the queue. Use adaptive filters to isolate significant orders and analyze who is defending a specific level.
Volume & Footprint Analysis
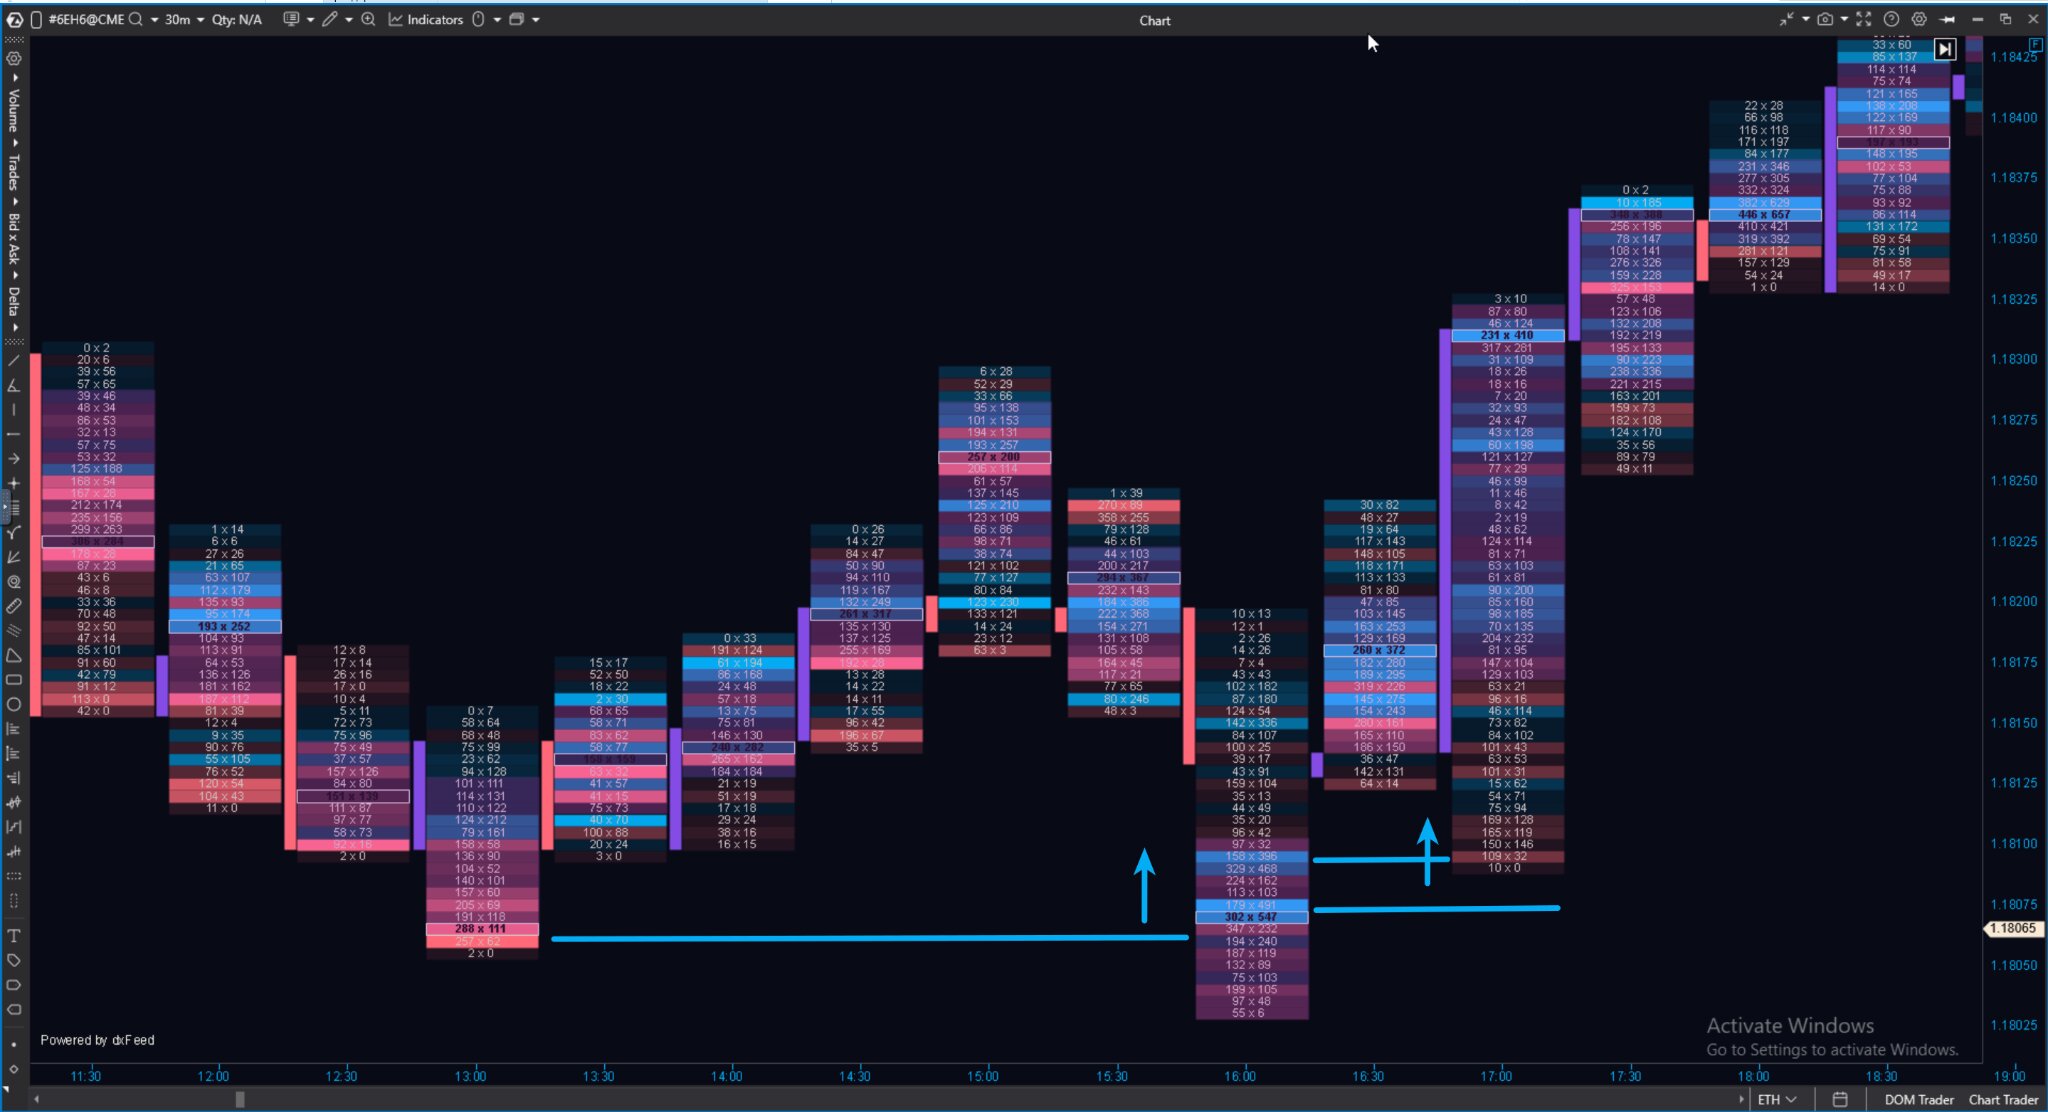
While standard candles only show price range, Footprint charts reveal the actual volume executed at every price point — giving you a detailed view of exactly where the biggest battle between buyers and sellers took place.
-
400+ Visualization Variations: Customize your clusters by Volume, Delta, Bid/Ask, or Trades. Filter the data to match your specific strategy, from scalping to long-term position trading.
-
Imbalance Detection: Define your own thresholds to highlight price levels where aggressive market orders significantly outweigh the opposition — identifying areas of extreme market pressure based on your specific parameters.
-
Dynamic Value Areas: Track the Point of Control (POC) and High-Volume Nodes (HVN) in real time to see where the market is finding fair price and where it is rejecting it.
Time-Independent Charting
Filter out market noise by choosing from 14 alternative chart types that focus purely on activity:
-
Volatility & Price Action: Use Range, Reversal, or Tick charts so new bars form only when significant trading occurs — eliminating “sideways noise” during low-volatility periods.
-
Structural Trends: Utilize Renko, Delta, and Cumulative Trades frames for pure price movement visualization, making it easier to identify long-term support and resistance zones without time-based distortions.
Professional Indicators
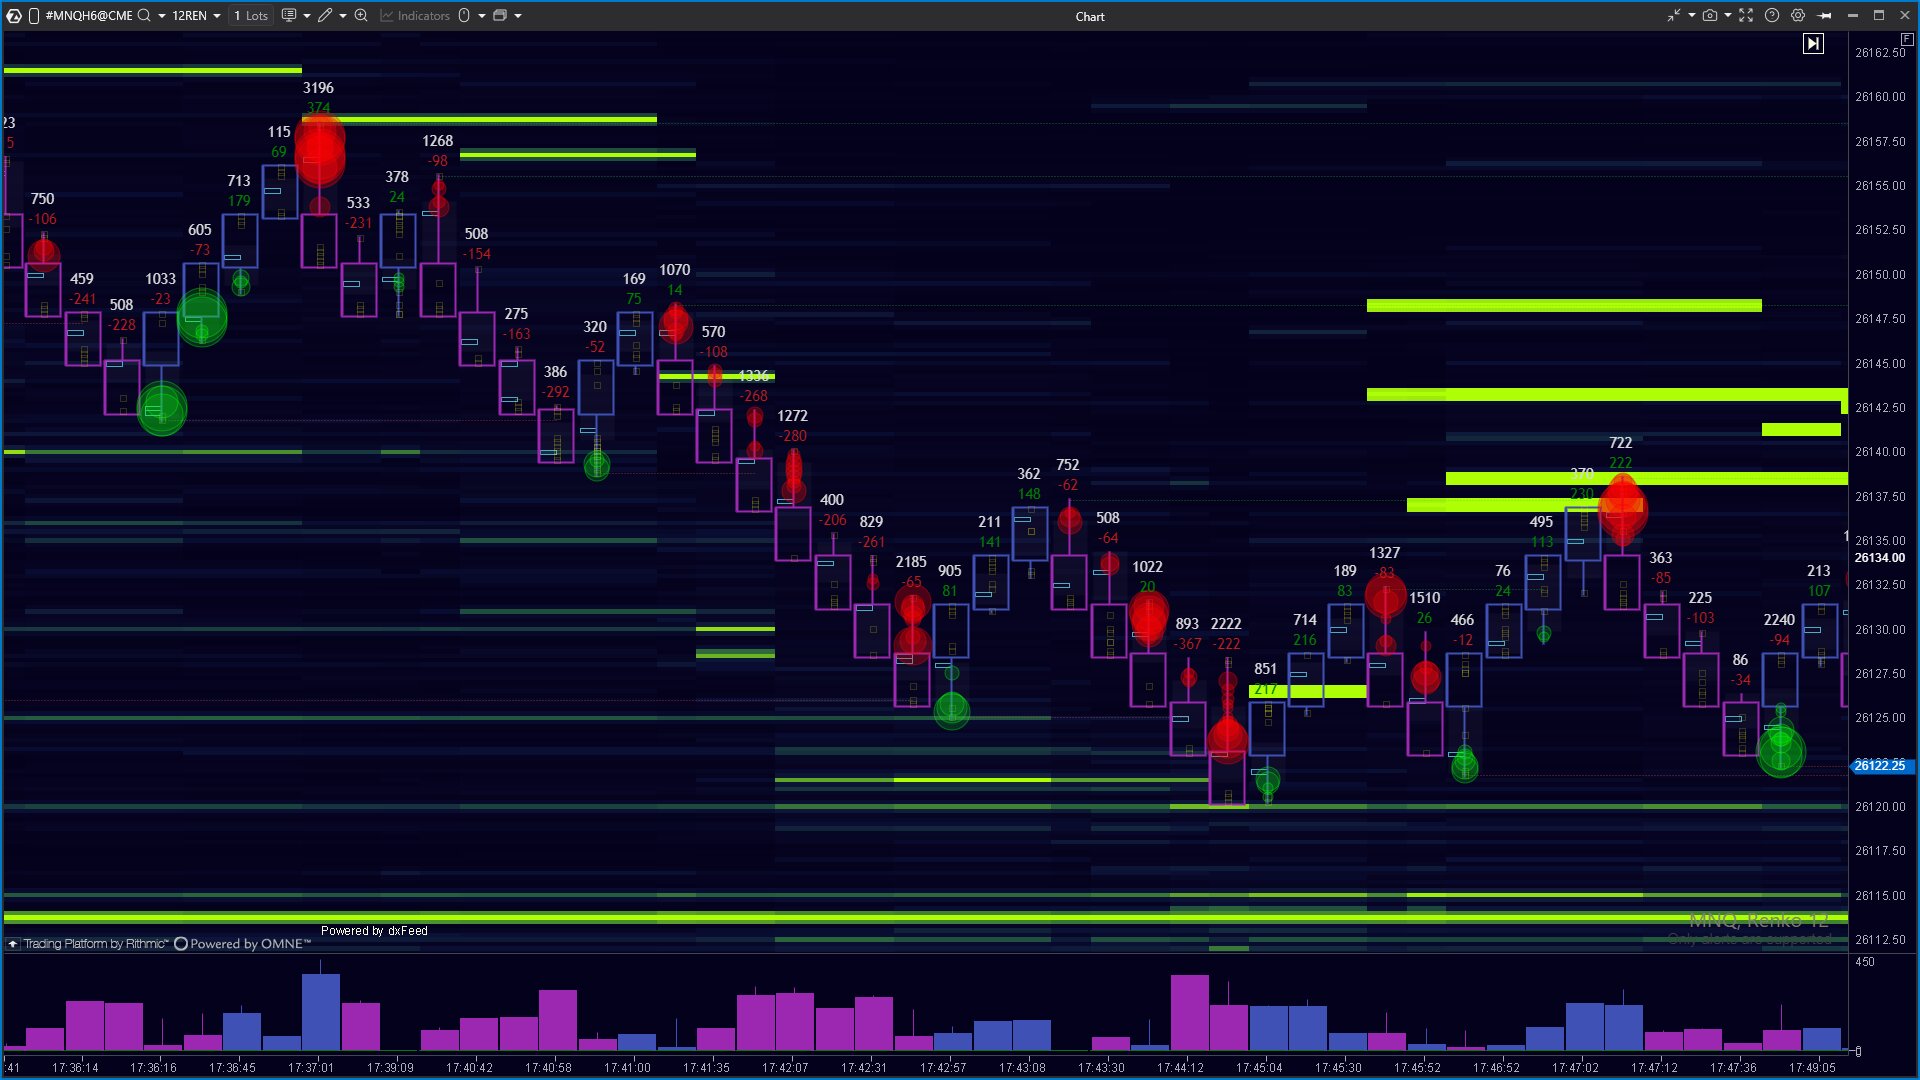
Standard tools rely on lagging price averages. ATAS provides a library of 240+ indicators that process raw, tick-by-tick data to reveal the real-time distribution of volume and market activity.
Cluster Search. A powerful scanning engine. Define specific volume or delta criteria to highlight unique patterns across any timeframe, making it easier to identify points of high interest.
Cluster Statistic. A professional data dashboard for every bar. Monitor Delta, Volume-at-Price, and session metrics to confirm the validity of any move.
Stacked Imbalance. Visualizes zones where multiple levels of aggressive buying or selling align — areas that often act as significant support or resistance.
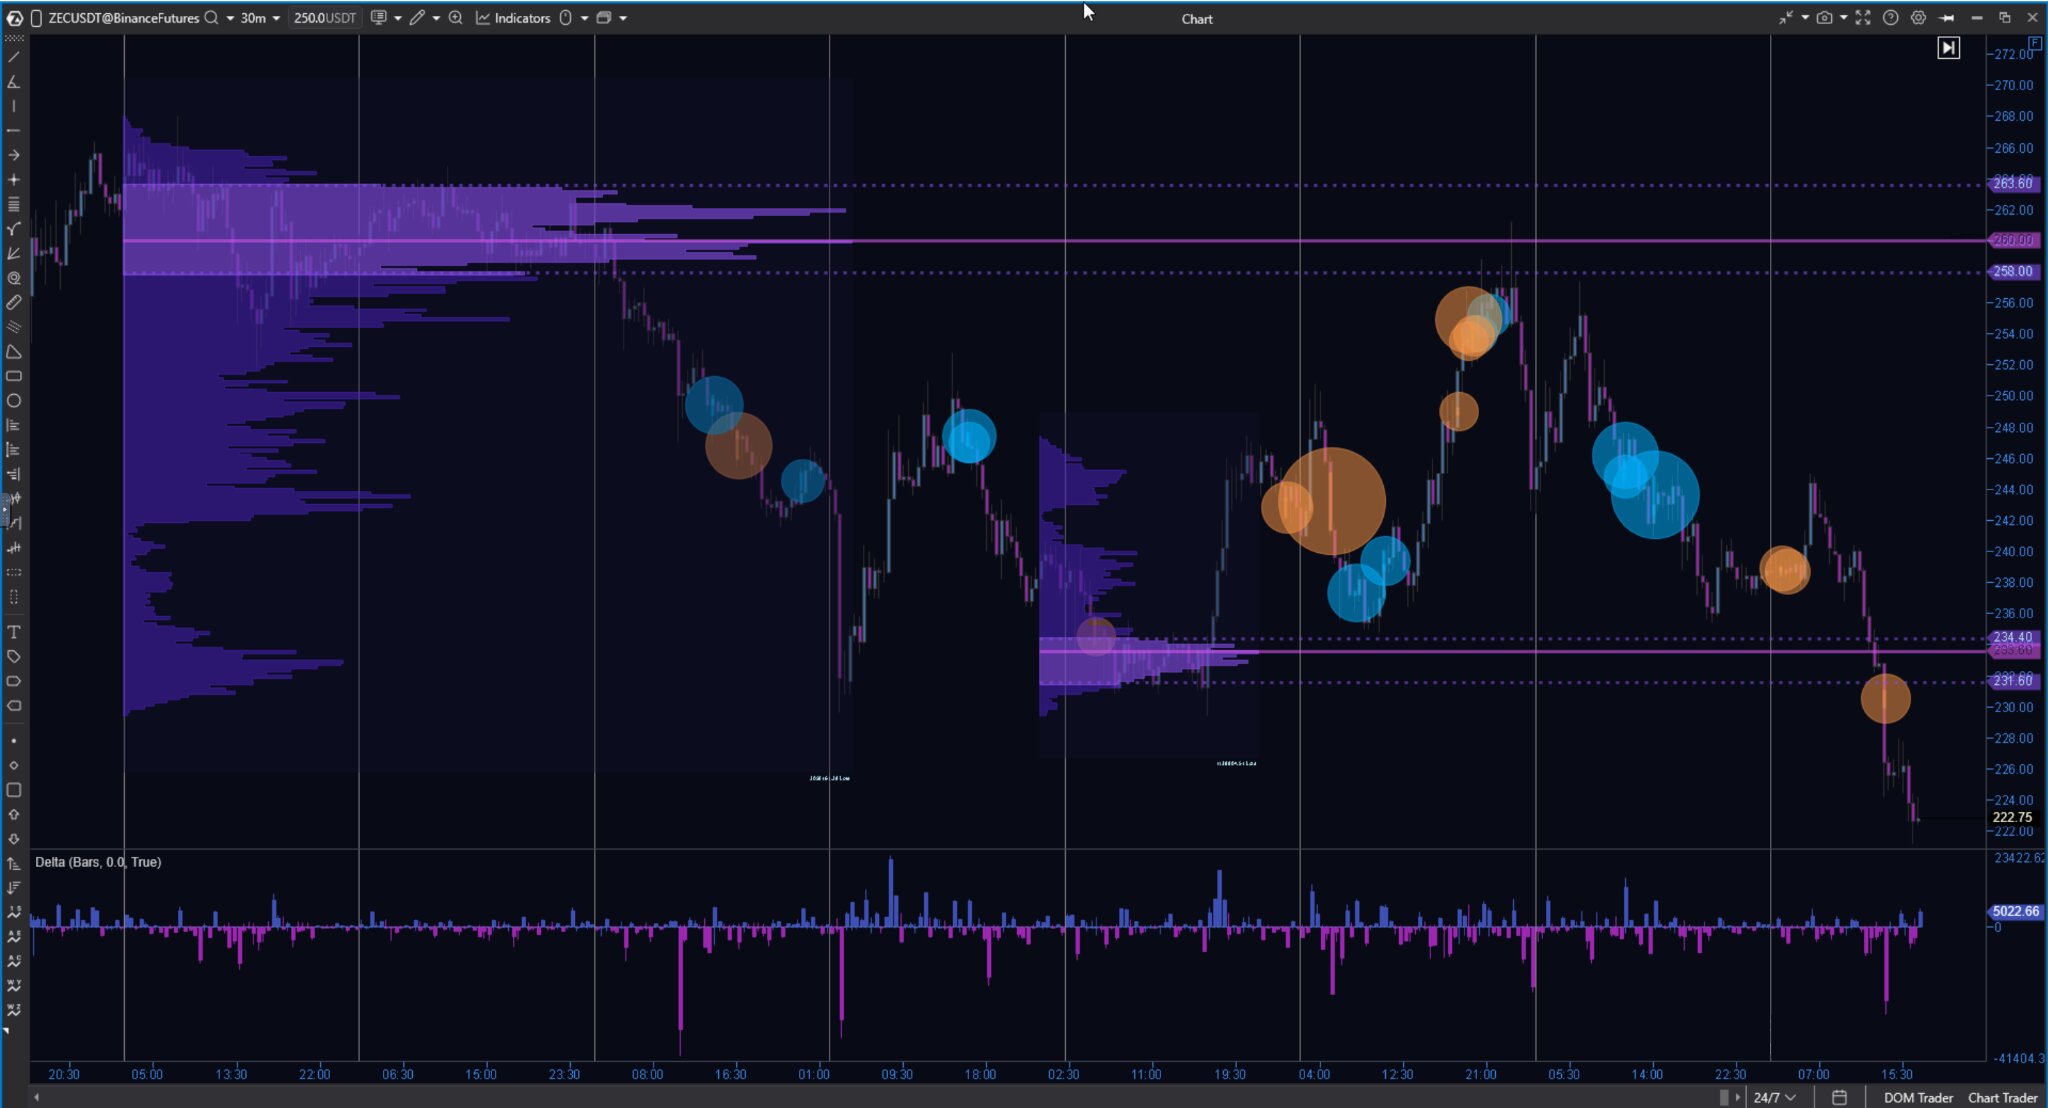
Big Trades & Adaptive Big Trades. A filter for large-print activity. While the standard version captures large individual prints, the Adaptive mode automatically adjusts to current market volatility, highlighting significant orders relative to the recent volume environment.
Cumulative Volume Delta (CVD). The primary tool for spotting market divergence. By tracking net buying/selling pressure, it reveals when price movement lacks real participation or is being absorbed by limit orders.
VWAP & TWAP. Professional benchmarks for institutional fair price. Track the Volume-Weighted Average Price to understand whether you are operating at a premium or a discount relative to the market’s true mean.
Professional Interface & Order Management
Experience a seamless transition from analysis to independent execution. ATAS serves as a professional-grade command center, providing a high-performance interface to manage your positions with precision and speed.
Visual Order Management
-
Chart Trader: A streamlined interface for manual order management. Place, modify, or cancel your orders directly on the price scale with intuitive drag-and-drop actions while keeping your eyes on the volume flow.
-
Smart DOM Execution: Independently manage your orders directly from the Order Book. Use the visual “thickness” of liquidity to time your entries and exits.
-
Hotkeys: Map every essential action — from opening a position to flattening all trades — to your keyboard for fast manual response.
Advanced Risk Management
-
Automated Exit Strategies (ATM): Pre-define your own exit rules. Set up templates that automatically deploy your Stop Loss and Take Profit orders the moment your entry is filled.
-
Custom Alerts: Monitor the market without constant screen time. Create personal triggers based on price levels, volume spikes, or indicator conditions — with notifications via sound, visual pop-ups, n8n, or Telegram.
-
Execution Analytics: Review your trade history and equity curves to identify patterns in your own execution and refine your strategy.